. 2012 Apr 1;205(7):1147-54.
doi: 10.1093/infdis/jis033. Epub 2012 Mar 1.

Early appearance of neutralizing immunoglobulin G3 antibodies is associated with chikungunya virus clearance and long-term clinical protection

Affiliations

Early appearance of neutralizing immunoglobulin G3 antibodies is associated with chikungunya virus clearance and long-term clinical protection

Yiu-Wing Kam et al. J Infect Dis. .

Abstract

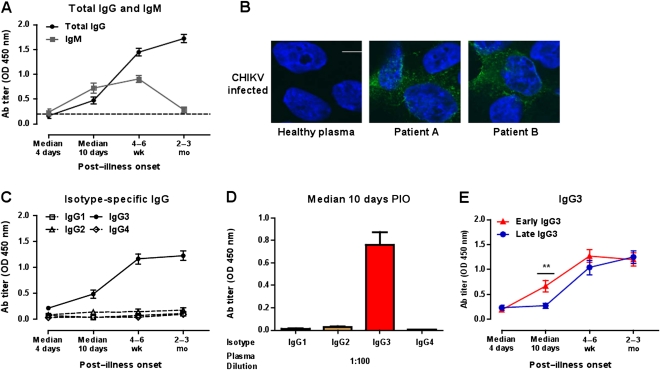
Background: Chikungunya virus (CHIKV) and related arboviruses have been responsible for large epidemic outbreaks with serious economic and social impact. Although infected individuals clear the virus from the blood, some develop debilitating and prolonged arthralgia.

Methods: We investigated specificity and strength of antibody responses in a longitudinal study on CHIKV-infected patients and analyzed their association with viral load, cytokine profile, and severity.

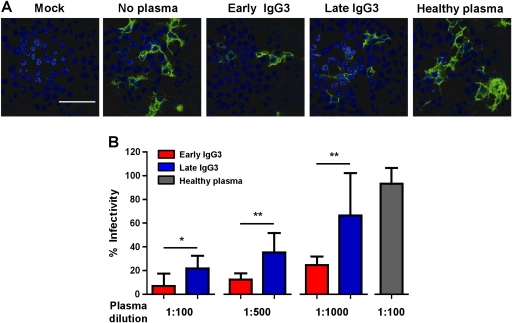
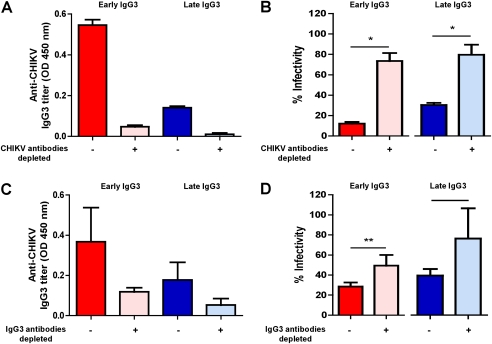
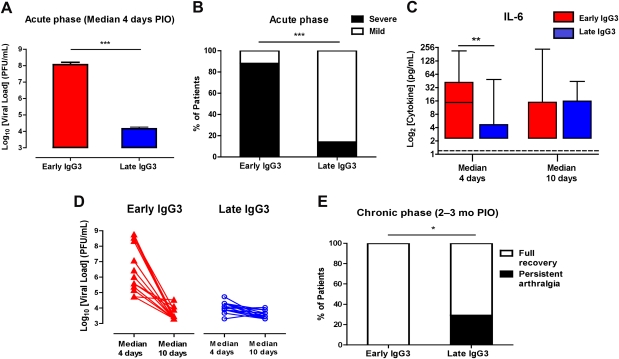
Results: We found that CHIKV-specific response is dominated by immunoglobulin G3 (IgG3) antibodies. The antibodies were neutralizing, and patients with high viremia rapidly developed high levels of anti-CHIKV antibodies of this specific isotype. Although these patients endured a more severe disease progression during the acute viremic phase, they cleared the virus faster and did not experience persistent arthralgia. However, significant persistent arthralgia was observed in patients with low viremia who developed IgG3 at a later stage.

Conclusions: Absence of early CHIKV-specific IgG3 may therefore serve as a specific marker of patients with increased risk of disease.


Figures

Figure 1.
Figure 1.
Antibody (Ab) profiles of chikungunya virus (CHIKV)–infected patients. A, Virus-specific immunoglobulin M (IgM) and immunoglobulin G (IgG) antibody titers in plasma samples (n = 30) at a dilution of 1:2000 were determined by enzyme-linked immunosorbent assay (ELISA) using purified CHIKV virions. B, Detection of CHIKV by plasma from CHIKV-infected patients. HEK 293T cells were infected with CHIKV (SGP11) at a multiplicity of infection of 10, fixed at 6 h postinfection, and stained with 2 representative patients’ plasma at 2–3 months post–illness onset (PIO) using a dilution of 1:500. Healthy plasma was used as a control. CHIKV antigen was detected by antihuman IgG antibody conjugated to Alexa Fluor 488 (green). 4′,6-diamidino-2-phenylindole (DAPI) was used to stain the nucleus. Scale bar: 10 μm. C, Virus-specific IgG isotype titers in plasma samples. Immunoglobulin G1 (IgG1) (□), immunoglobulin G2 (IgG2) (Δ), immunoglobulin G3 (IgG3) (•), or immunoglobulin G4 (IgG4) (⋄) Abs were determined as in (A) using specific secondary antibodies. Each point represents the mean of 30 patients’ samples from the cohort. D, Chikungunya virion–based ELISA was used to determine virus-specific IgG isotype titers in plasma samples (median, 10 d PIO; n = 30) at a dilution of 1:100. Anti-CHIKV IgG1, IgG2, IgG3, or IgG4 Abs were determined using specific secondary Abs. Data are presented as mean ± standard error of the mean (SEM) of 30 patients’ samples and are representative of 2 independent experiments with similar results. E, Profile of IgG3 levels at different times PIO in early (n = 16) and late IgG3 responders (n = 14) according to the pattern of IgG3 titer at median, 10 d PIO. Data are presented as mean ± SEM. Data are representative of 2 independent experiments with similar results. Statistical significance was measured using Mann–Whitney U test. **P < .01. Abbreviation: OD, optical density.
Figure 2.
Figure 2.
Neutralizing capacity of anti–chikungunya virus (CHIKV) immunoglobulin G3 (IgG3) antibodies. A, Visualization of CHIKV by immunofluorescence in infected cultures after seroneutralization. Virus samples were preincubated with patients’ plasma collected at median 10 d post–illness onset (PIO) from early and late IgG3 groups before being added to the cells. Noninfected (mock) or virus samples preincubated with healthy donor plasma were used as controls. Analysis was performed at 6 h postinfection. Images were captured with 60× magnification. Scale bar: 50 μm. Representative microscopic images per treatment condition are illustrated. B, In vitro neutralizing activity against CHIKV from plasma samples of early and late IgG3 responders. Plasma samples (median, 10 d PIO) were tested in triplicates at different dilutions. Healthy plasma was used as a control and performed in the same conditions. Dilution at 1:100 is shown. Results are presented as mean ± SD of percentage control infection. Data are representative of 3 independent experiments. Statistical significance was measured using Mann–Whitney U test. *P < .05. **P < .01.
Figure 3.
Figure 3.
Role of anti–chikungunya virus (CHIKV) immunoglobulin G3 (IgG3) in in vitro neutralizing activity against CHIKV from plasma samples of early and late IgG3 responders. A, Pooled plasma samples collected at median 10 d post–illness onset (PIO) (early IgG3, n = 16; late IgG3, n = 14) were added to plates precoated with purified Chikungunya virion for depletion of anti-CHIKV antibodies. Depleted samples were subjected to anti-CHIKV IgG3 antibody detection with virion-based enzyme-linked immunosorbent assay (ELISA). B, Depleted samples were subjected to in vitro neutralizing activity detection with a seroneutralization assay. C, IgG3 antibodies from pooled plasma samples collected at a median of 10 d PIO (early IgG3, n = 16; late IgG3, n = 14) were depleted as described in the “Methods” section and measured for anti-CHIKV IgG3 antibodies with virion-based ELISA. D, Depleted samples were subjected to in vitro neutralizing detection in a seroneutralization assay. All samples assayed were performed at 1:500 dilution (n = 3). Plasma from healthy donors was used as negative controls. Data are presented as mean ± SD. Data are representative of 3 independent experiments. Statistical significance was measured using Mann–Whitney U test. *P < .05. **P < .01.
Figure 4.
Figure 4.
Association of immunoglobulin G3 (IgG3) antibody responses with disease progression. A, Viral load in early and late IgG3 responders during the acute phase of disease (median, 4 d post–illness onset [PIO]). Data are presented as mean ± standard error of the mean. Statistical significance was measured using Mann–Whitney U test. ***P < .001. Abbreviation: PFU, plaque-forming units. B, Disease severity in early and late IgG3 responders during the acute phase of disease. Severity was previously defined. Histogram shows the percentage of patients with mild (n = 14) or acute severe clinical phenotypes (n = 16). Statistical significance was measured using 2-sided Fisher exact test between the number of patients with severe phenotype in 2 responder groups. ***P < .0001. C, Interleukin 6 levels in early and late IgG3 responders were determined using a multiplex-bead based assay. Horizontal dotted lines represent median values of healthy controls. Statistical significance was measured using Mann–Whitney U test. **P < .01. D, Viral clearance from a median of 4 d to a median of 10 d PIO in early and late IgG3 responders. E, Persistent arthralgia in early and late IgG3 responders during the chronic phase of disease (2–3 mo PIO). Histogram shows the percentage of patients with full recovery or persistent arthralgia. Statistical significance was measured using 2-sided Fisher exact test between the patients who have fully recovered and patients with persistent arthralgia in the 2 responder groups. *P = .04.

References

    1. Powers AM, Logue CH. Changing patterns of chikungunya virus: re-emergence of a zoonotic arbovirus. J Gen Virol. 2007;88:2363–77. - PubMed
    1. Higgs S. The 2005–2006 chikungunya epidemic in the Indian Ocean. Vector Borne Zoonotic Dis. 2006;6:115–6. - PubMed
    1. Lumsden WH. An epidemic of virus disease in Southern Province, Tanganyika Territory, in 1952–53. II. General description and epidemiology. Trans R Soc Trop Med Hyg. 1955;49:33–57. - PubMed
    1. Robinson MC. An epidemic of virus disease in Southern Province, Tanganyika Territory, in 1952–53. I. Clinical features. Trans R Soc Trop Med Hyg. 1955;49:28–32. - PubMed
    1. Kondekar S, Gogtay NJ. Why chikungunya is called chikungunya. J Post Med. 2006;52:307.

Publication types