

Functional protein pathway activation mapping of the progression of normal skin to squamous cell carcinoma
- PMID: 22389437
- PMCID: PMC3297971
- DOI: 10.1158/1940-6207.CAPR-11-0427
Functional protein pathway activation mapping of the progression of normal skin to squamous cell carcinoma
Erratum in
- Cancer Prev Res (Phila). 2012 Aug;5(8):1072. Pellicani, Giovanni [corrected to Pellacani, Giovanni]
Abstract
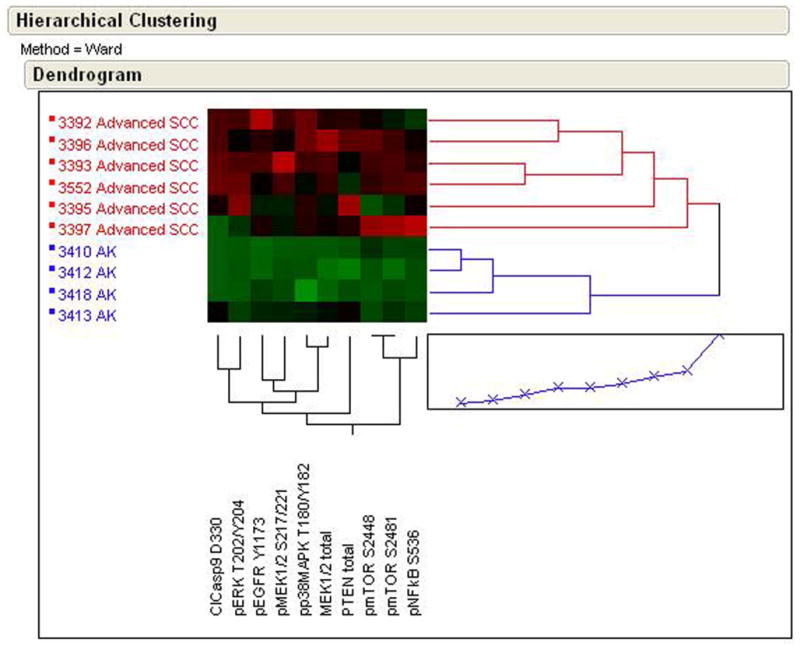
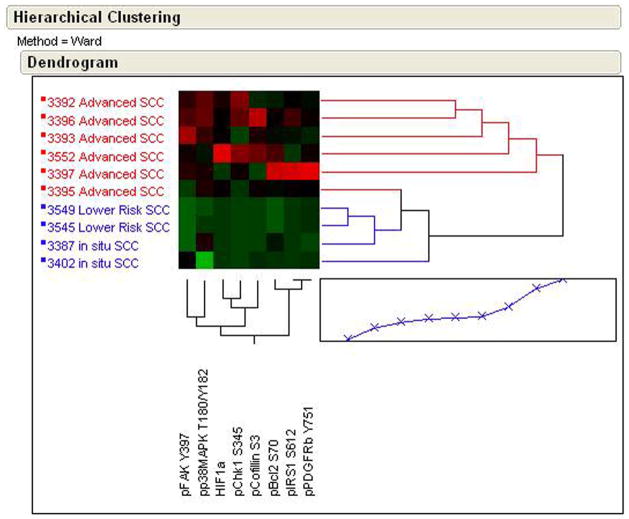
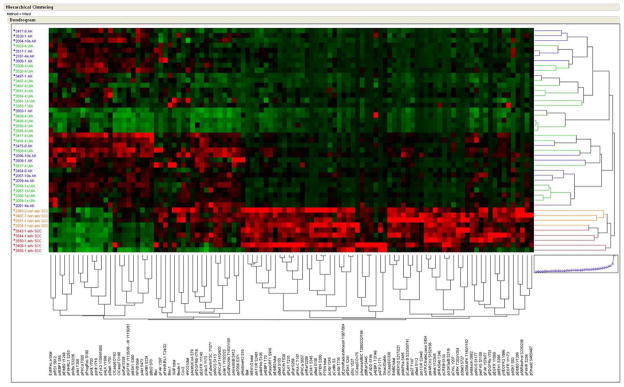
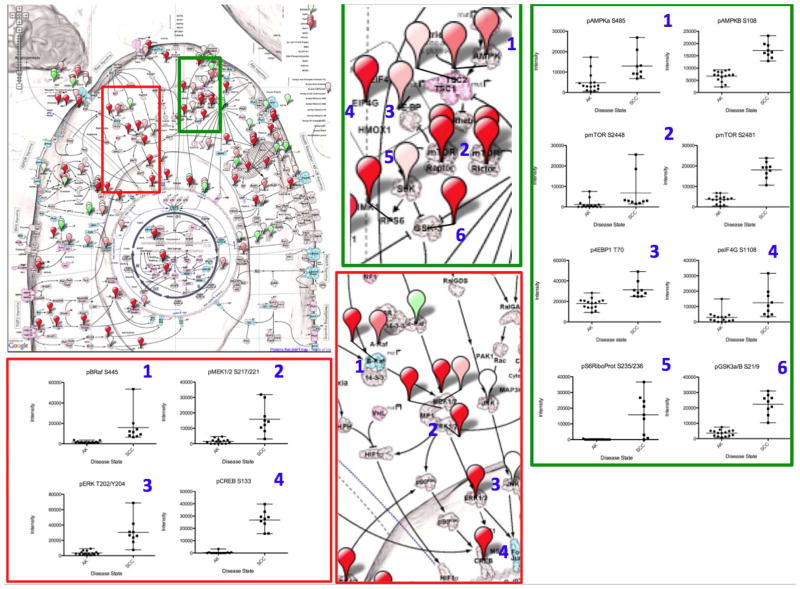
Reverse phase protein microarray analysis was used to identify cell signaling derangements in squamous cell carcinoma (SCC) compared with actinic keratosis (AK) and upper inner arm (UIA). We analyzed two independent tissue sets with isolation and enrichment of epithelial cells by laser capture microdissection. Set 1 served as a pilot and a means to identify protein pathway activation alterations that could be further validated in a second independent set. Set 1 was comprised of 4 AK, 13 SCC, and 20 UIA. Set 2 included 15 AK, 9 SCCs, and 20 UIAs. Activation of 51 signaling proteins, known to be involved in tumorigenesis, were assessed for set 1 and showed that the MEK-ERK [mitogen-activated protein (MAP)/extracellular signal-regulated (ERK; MEK)] pathway was activated in SCC compared with AK and UIA, and that epidermal growth factor receptor (EGFR) and mTOR pathways were aberrantly activated in SCC. Unsupervised two-way hierarchical clustering revealed that AK and UIA shared a common signaling network activation architecture while SCC was dramatically different. Statistical analysis found that prosurvival signaling through phosphorylation of ASK and 4EBP1 as well as increased Bax and Bak expression was higher in AK compared with UIA. We expanded pathway network activation mapping in set 2 to 101 key signaling proteins, which corroborated activation of MEK-ERK, EGFR, and mTOR pathways through discovery of a number of upstream and downstream signaling molecules within these pathways to conclude that SCC is indeed a pathway activation-driven disease. Pathway activation mapping of SCC compared with AK revealed several interconnected networks that could be targeted with drug therapy for potential chemoprevention and therapeutic applications.
Conflict of interest statement
Figures
Similar articles
-
Cyclin A and beta-catenin expression in actinic keratosis, Bowen's disease and invasive squamous cell carcinoma of the skin.Br J Dermatol. 2005 Dec;153(6):1166-75. doi: 10.1111/j.1365-2133.2005.06898.x. Br J Dermatol. 2005. PMID: 16307653
-
Gene expression patterns of normal human skin, actinic keratosis, and squamous cell carcinoma: a spectrum of disease progression.Arch Dermatol. 2010 Mar;146(3):288-93. doi: 10.1001/archdermatol.2009.378. Arch Dermatol. 2010. PMID: 20231500
-
A pilot characterization of human lung NSCLC by protein pathway activation mapping.J Thorac Oncol. 2012 Dec;7(12):1755-1766. doi: 10.1097/JTO.0b013e3182725fc7. J Thorac Oncol. 2012. PMID: 23154546 Free PMC article.
-
Progression of actinic keratosis to squamous cell carcinoma revisited: clinical and treatment implications.Cutis. 2011 Apr;87(4):201-7. Cutis. 2011. PMID: 21644496 Review.
-
Epidermal growth factor receptor (EGFR) and squamous cell carcinoma of the skin: molecular bases for EGFR-targeted therapy.Pathol Res Pract. 2011 Jun 15;207(6):337-42. doi: 10.1016/j.prp.2011.03.002. Epub 2011 Apr 29. Pathol Res Pract. 2011. PMID: 21531084 Review.
Cited by
-
Inhibition of mTOR suppresses UVB-induced keratinocyte proliferation and survival.Cancer Prev Res (Phila). 2012 Dec;5(12):1394-404. doi: 10.1158/1940-6207.CAPR-12-0272-T. Epub 2012 Nov 5. Cancer Prev Res (Phila). 2012. PMID: 23129577 Free PMC article.
-
Long non-coding RNAs in cutaneous biology and keratinocyte carcinomas.Cell Mol Life Sci. 2020 Nov;77(22):4601-4614. doi: 10.1007/s00018-020-03554-3. Epub 2020 May 27. Cell Mol Life Sci. 2020. PMID: 32462404 Free PMC article. Review.
-
The Potential of Plant Phenolics in Prevention and Therapy of Skin Disorders.Int J Mol Sci. 2016 Feb 18;17(2):160. doi: 10.3390/ijms17020160. Int J Mol Sci. 2016. PMID: 26901191 Free PMC article. Review.
-
Far-infrared suppresses skin photoaging in ultraviolet B-exposed fibroblasts and hairless mice.PLoS One. 2017 Mar 16;12(3):e0174042. doi: 10.1371/journal.pone.0174042. eCollection 2017. PLoS One. 2017. PMID: 28301572 Free PMC article.
-
Negative regulation of the FOXO3a transcription factor by mTORC2 induces a pro-survival response following exposure to ultraviolet-B irradiation.Cell Signal. 2016 Aug;28(8):798-809. doi: 10.1016/j.cellsig.2016.03.013. Epub 2016 Apr 4. Cell Signal. 2016. PMID: 27058291 Free PMC article.
References
-
- Rigel DS. Cutaneous ultraviolet exposure and its relationship to the development of skin cancer. J Am Acad Dermatol. 2008;58:S129–32. - PubMed
-
- ACS. Cancer Facts and Figures 2011. Atlanta: American Cancer Society; 2011.
-
- Greenlee RT, Murray T, Bolden S, Wingo PA. Cancer statistics, 2000. Ca: a Cancer Journal for Clinicians. 2000;50:7–33. - PubMed
-
- Moller R, Reymann F, Hou-Jensen K. Metastases in dermatological patients with squamous cell carcinoma. Archives of Dermatology. 1979;115:703–5. - PubMed
Publication types
MeSH terms
Grants and funding
LinkOut - more resources
Full Text Sources
Other Literature Sources
Medical
Research Materials
Miscellaneous
