

A galectin-3-dependent pathway upregulates interleukin-6 in the microenvironment of human neuroblastoma
- PMID: 22389450
- PMCID: PMC3815584
- DOI: 10.1158/0008-5472.CAN-11-2165
A galectin-3-dependent pathway upregulates interleukin-6 in the microenvironment of human neuroblastoma
Abstract
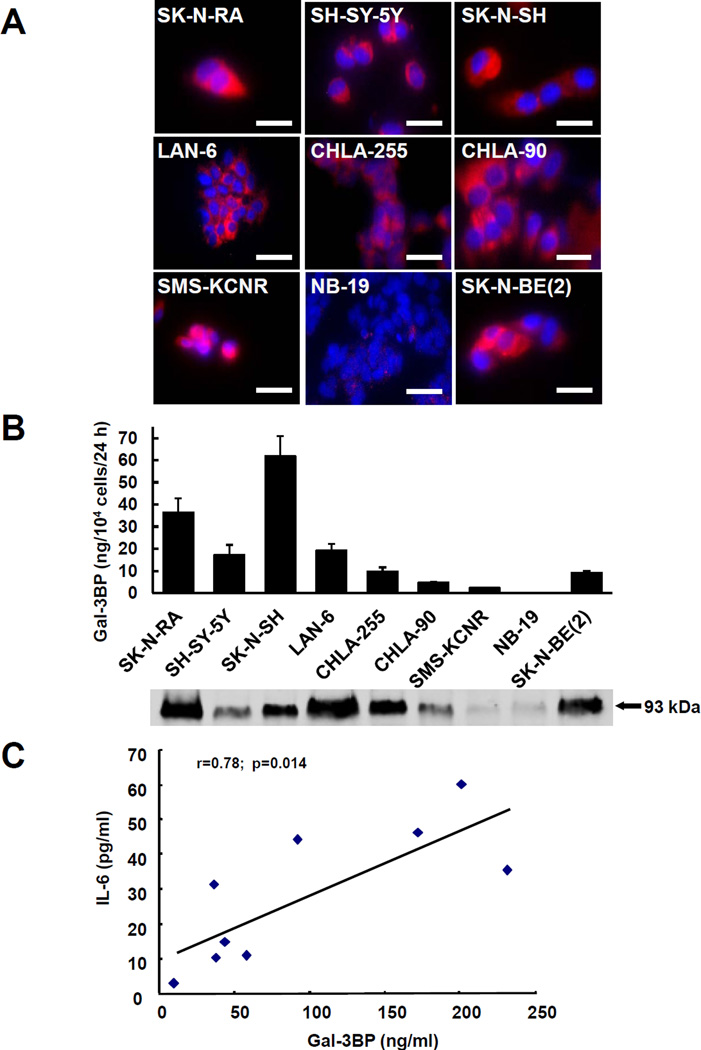
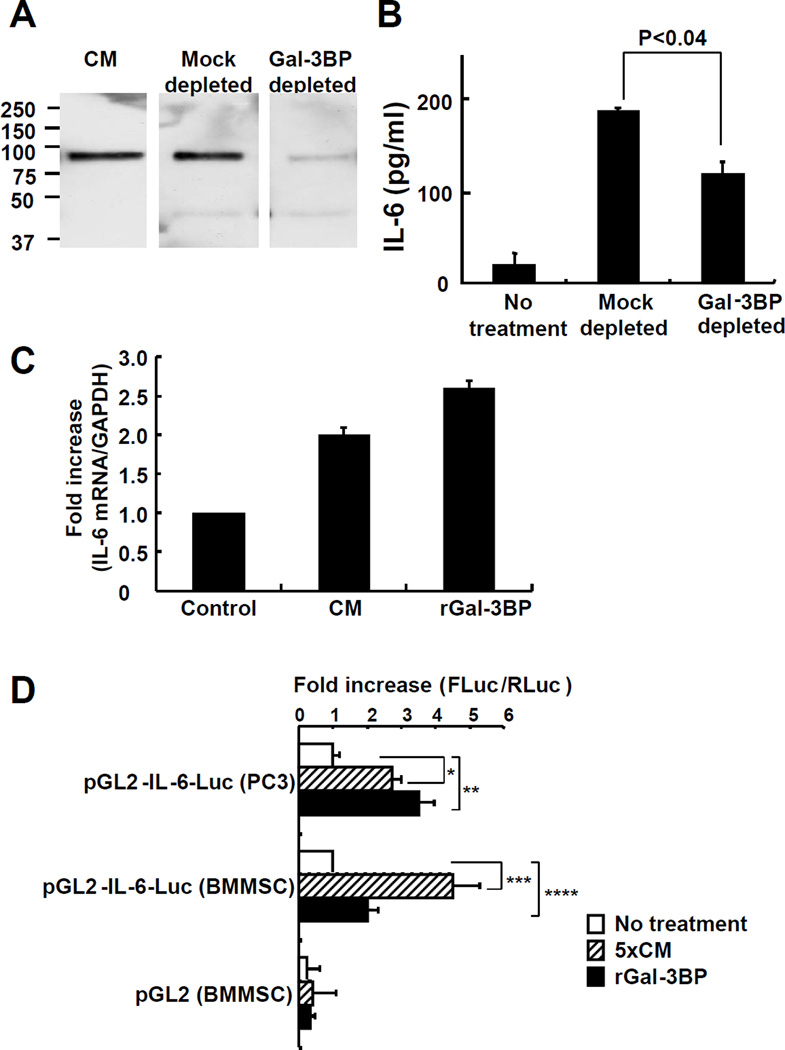
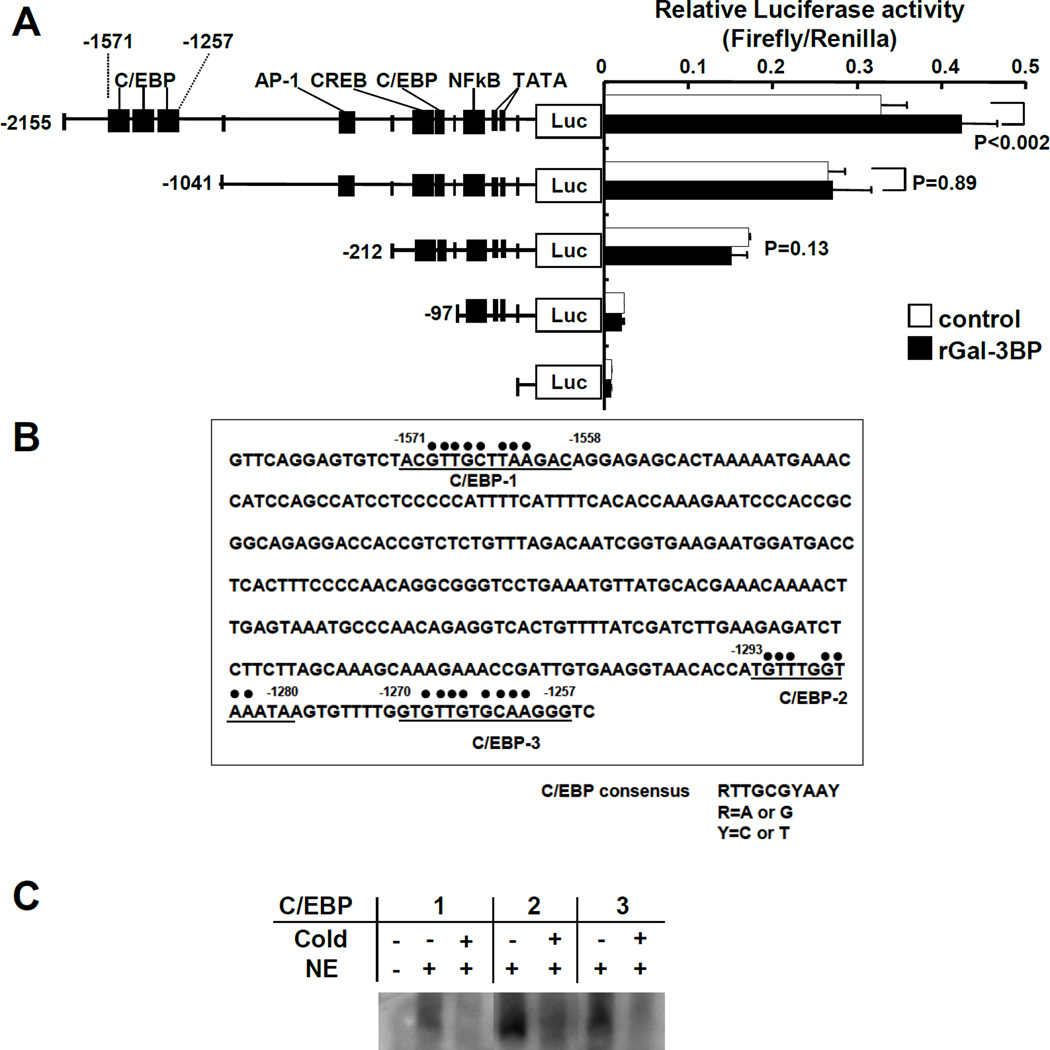
Interleukin-6 (IL-6) is a pleiotropic cytokine with a broad range of physiologic and pathologic functions. Because in cancer, IL-6 contributes to a microenvironment that promotes tumor cell survival, angiogenesis, and inflammation, understanding the mechanism responsible for its production is important. In neuroblastoma, the second most common solid tumor in children, IL-6 is produced not by tumor cells but by stromal cells such as monocytes and bone marrow mesenchymal stem cells (BMMSC). Here we show that the production of IL-6 in BMMSCs is in part stimulated by galectin-3 binding protein (Gal-3BP) secreted by neuroblastoma cells. We identified a distal region of the IL-6 promoter that contains 3 CCATT/enhancer binding protein (C/EBP) binding domains involved in the transcriptional upregulation of IL-6 by Gal-3BP. Gal-3BP interacted with Galectin-3 (Gal-3) present in BMMSCs, and a Gal-3BP/Gal-3/Ras/MEK/ERK signaling pathway was responsible for the transcriptional upregulation of IL-6 in BMMSCs in which Gal-3 has a necessary function. In support of the role of this pathway in human neuroblastoma tumors, Gal-3BP was found to be present in tumor cells and in the adjacent extracellular matrix of 96% of 78 primary neuroblastoma tumor samples examined by immunohistochemistry. Considering the protumorigenic function of IL-6 in cancer, this tumor cell-stromal cell interactive pathway could be a target for anticancer therapy.
©2012 AACR
Figures


Similar articles
-
Identification of galectin-3-binding protein as a factor secreted by tumor cells that stimulates interleukin-6 expression in the bone marrow stroma.J Biol Chem. 2008 Jul 4;283(27):18573-81. doi: 10.1074/jbc.M803115200. Epub 2008 May 1. J Biol Chem. 2008. PMID: 18450743
-
Cancer-Associated Fibroblasts Share Characteristics and Protumorigenic Activity with Mesenchymal Stromal Cells.Cancer Res. 2017 Sep 15;77(18):5142-5157. doi: 10.1158/0008-5472.CAN-16-2586. Epub 2017 Jul 7. Cancer Res. 2017. PMID: 28687621 Free PMC article.
-
Interleukin-6 in the bone marrow microenvironment promotes the growth and survival of neuroblastoma cells.Cancer Res. 2009 Jan 1;69(1):329-37. doi: 10.1158/0008-5472.CAN-08-0613. Cancer Res. 2009. PMID: 19118018 Free PMC article.
-
Gal-3BP in Viral Infections: An Emerging Role in Severe Acute Respiratory Syndrome Coronavirus 2.Int J Mol Sci. 2022 Jun 30;23(13):7314. doi: 10.3390/ijms23137314. Int J Mol Sci. 2022. PMID: 35806317 Free PMC article. Review.
-
More than the genes, the tumor microenvironment in neuroblastoma.Cancer Lett. 2016 Sep 28;380(1):304-14. doi: 10.1016/j.canlet.2015.11.017. Epub 2015 Nov 17. Cancer Lett. 2016. PMID: 26597947 Free PMC article. Review.
Cited by
-
Increased LGALS3 expression independently predicts shorter overall survival in patients with the proneural subtype of glioblastoma.Cancer Med. 2019 May;8(5):2031-2040. doi: 10.1002/cam4.2075. Epub 2019 Mar 7. Cancer Med. 2019. PMID: 30848102 Free PMC article.
-
PD-1 immunology in the kidneys: a growing relationship.Front Immunol. 2024 Oct 23;15:1458209. doi: 10.3389/fimmu.2024.1458209. eCollection 2024. Front Immunol. 2024. PMID: 39507530 Free PMC article. Review.
-
Physiological, Tumor, and Metastatic Niches: Opportunities and Challenges for Targeting the Tumor Microenvironment.Crit Rev Oncog. 2015;20(3-4):301-14. doi: 10.1615/critrevoncog.2015013668. Crit Rev Oncog. 2015. PMID: 26349421 Free PMC article. Review.
-
MYC regulates metabolism through vesicular transfer of glycolytic kinases.Open Biol. 2021 Dec;11(12):210276. doi: 10.1098/rsob.210276. Epub 2021 Dec 1. Open Biol. 2021. PMID: 34847775 Free PMC article.
-
Association between circulating galectin-3 levels and the immunological, inflammatory and nutritional parameters in patients with colorectal cancer.Biomed Rep. 2016 Aug;5(2):203-207. doi: 10.3892/br.2016.696. Epub 2016 May 30. Biomed Rep. 2016. PMID: 27446542 Free PMC article.
References
-
- Tlsty TD, Coussens LM. Tumor stroma and regulation of cancer development. Annu Rev Pathol. 2006;1:119–150. - PubMed
-
- van Kempen LC, Ruiter DJ, van Muijen GN, Coussens LM. The tumor microenvironment: a critical determinant of neoplastic evolution. Eur J Cell Biol. 2003;82:539–548. - PubMed
-
- Witz IP. Tumor-microenvironment interactions: dangerous liaisons. Adv Cancer Res. 2008;100:203–229. - PubMed
-
- Hanahan D, Weinberg RA. Hallmarks of cancer: the next generation. Cell. 2011;144:646–674. - PubMed
Publication types
MeSH terms
Substances
Grants and funding
LinkOut - more resources
Full Text Sources
Other Literature Sources
Medical
Miscellaneous
