A global investigation of the Bacillus subtilis iron-sparing response identifies major changes in metabolism
- PMID: 22389480
- PMCID: PMC3347201
- DOI: 10.1128/JB.05990-11
A global investigation of the Bacillus subtilis iron-sparing response identifies major changes in metabolism
Abstract
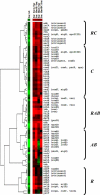
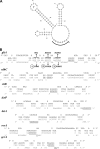
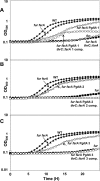
The Bacillus subtilis ferric uptake regulator (Fur) protein is the major sensor of cellular iron status. When iron is limiting for growth, derepression of the Fur regulon increases the cellular capacity for iron uptake and mobilizes an iron-sparing response mediated in large part by a small noncoding RNA named FsrA. FsrA functions, in collaboration with three small basic proteins (FbpABC), to repress many "low-priority" iron-containing enzymes. We have used transcriptome analyses to gain insights into the scope of the iron-sparing response and to define subsets of genes dependent for their repression on FsrA, FbpAB, and/or FbpC. Enzymes of the tricarboxylic acid (TCA) cycle, including aconitase and succinate dehydrogenase (SDH), are major targets of FsrA-mediated repression, and as a consequence, flux through this pathway is significantly decreased in a fur mutant. FsrA also represses the DctP dicarboxylate permease and the iron-sulfur-containing enzyme glutamate synthase (GltAB), which serves as a central link between carbon and nitrogen metabolism. Allele-specific suppression analysis was used to document a direct RNA-RNA interaction between the FsrA small RNA (sRNA) and the gltAB leader region. We further demonstrated that distinct regions of FsrA are required for the translational repression of the GltAB and SDH enzyme complexes.
Figures


Similar articles
-
The FsrA sRNA and FbpB protein mediate the iron-dependent induction of the Bacillus subtilis lutABC iron-sulfur-containing oxidases.J Bacteriol. 2012 May;194(10):2586-93. doi: 10.1128/JB.05567-11. Epub 2012 Mar 16. J Bacteriol. 2012. PMID: 22427629 Free PMC article.
-
The Bacillus subtilis iron-sparing response is mediated by a Fur-regulated small RNA and three small, basic proteins.Proc Natl Acad Sci U S A. 2008 Aug 19;105(33):11927-32. doi: 10.1073/pnas.0711752105. Epub 2008 Aug 12. Proc Natl Acad Sci U S A. 2008. PMID: 18697947 Free PMC article.
-
Sequential induction of Fur-regulated genes in response to iron limitation in Bacillus subtilis.Proc Natl Acad Sci U S A. 2017 Nov 28;114(48):12785-12790. doi: 10.1073/pnas.1713008114. Epub 2017 Nov 13. Proc Natl Acad Sci U S A. 2017. PMID: 29133393 Free PMC article.
-
Global analysis of the Bacillus subtilis Fur regulon and the iron starvation stimulon.Mol Microbiol. 2002 Sep;45(6):1613-29. doi: 10.1046/j.1365-2958.2002.03113.x. Mol Microbiol. 2002. PMID: 12354229
-
How we learnt about iron acquisition in Pseudomonas aeruginosa: a series of very fortunate events.Biometals. 2007 Jun;20(3-4):587-601. doi: 10.1007/s10534-006-9067-2. Epub 2006 Dec 22. Biometals. 2007. PMID: 17186376 Review.
Cited by
-
A nitric oxide regulated small RNA controls expression of genes involved in redox homeostasis in Bacillus subtilis.PLoS Genet. 2015 Feb 2;11(2):e1004957. doi: 10.1371/journal.pgen.1004957. eCollection 2015 Feb. PLoS Genet. 2015. PMID: 25643072 Free PMC article.
-
Specificity of metal sensing: iron and manganese homeostasis in Bacillus subtilis.J Biol Chem. 2014 Oct 10;289(41):28112-20. doi: 10.1074/jbc.R114.587071. Epub 2014 Aug 26. J Biol Chem. 2014. PMID: 25160631 Free PMC article. Review.
-
Role of BrnQ1 and BrnQ2 in branched-chain amino acid transport and virulence in Staphylococcus aureus.Infect Immun. 2015 Mar;83(3):1019-29. doi: 10.1128/IAI.02542-14. Epub 2014 Dec 29. Infect Immun. 2015. PMID: 25547798 Free PMC article.
-
PfeT, a P1B4 -type ATPase, effluxes ferrous iron and protects Bacillus subtilis against iron intoxication.Mol Microbiol. 2015 Nov;98(4):787-803. doi: 10.1111/mmi.13158. Epub 2015 Sep 10. Mol Microbiol. 2015. PMID: 26261021 Free PMC article.
-
Encapsulated Ferritin-like Proteins: A Structural Perspective.Biomolecules. 2024 May 25;14(6):624. doi: 10.3390/biom14060624. Biomolecules. 2024. PMID: 38927029 Free PMC article. Review.
References
-
- Baichoo N, Wang T, Ye R, Helmann JD. 2002. Global analysis of the Bacillus subtilis Fur regulon and the iron starvation stimulon. Mol. Microbiol. 45:1613–1629 - PubMed
-
- Brush A, Paulus H. 1971. The enzymic formation of O-acetylhomoserine in Bacillus subtilis and its regulation by methionine and S-adenosylmethionine. Biochem. Biophys. Res. Commun. 45:735–741 - PubMed
Publication types
MeSH terms
Substances
Associated data
- Actions
Grants and funding
LinkOut - more resources
Full Text Sources
Medical
Molecular Biology Databases

