. 2011 Jul;14(7-8):330-338.
doi: 10.1016/S1369-7021(11)70163-8.

Magnetite Nanoparticles for Medical MR Imaging

Affiliations

Magnetite Nanoparticles for Medical MR Imaging

Zachary R Stephen et al. Mater Today (Kidlington). 2011 Jul.

Abstract

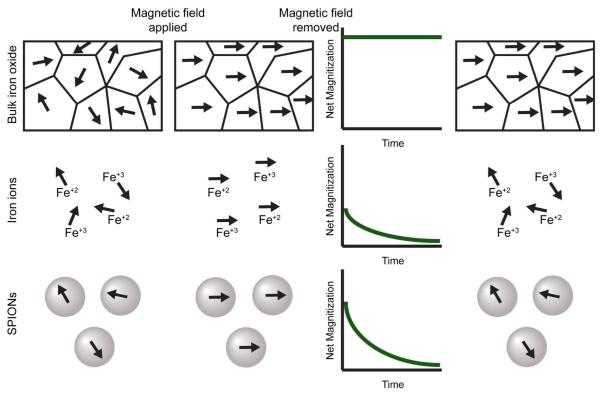
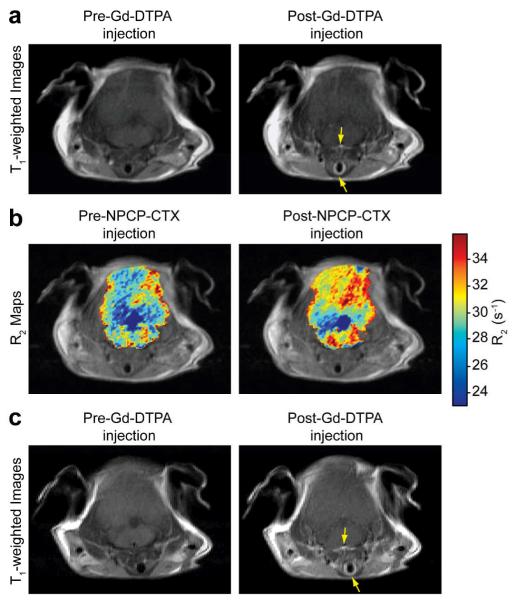
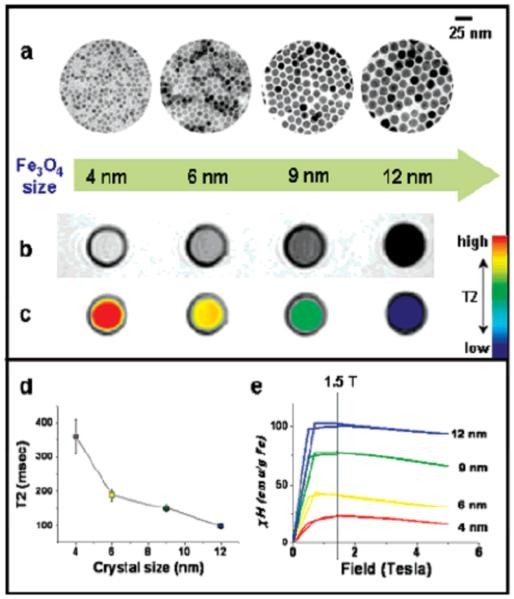
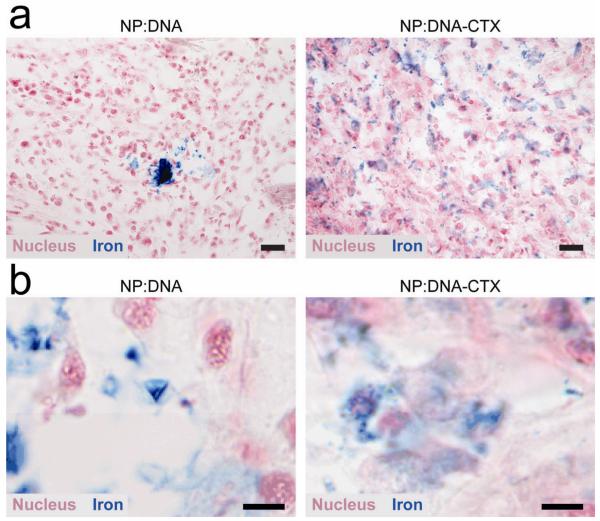
Nanotechnology has given scientists new tools for the development of advanced materials for the detection and diagnosis of disease. Iron oxide nanoparticles (SPIONs) in particular have been extensively investigated as novel magnetic resonance imaging (MRI) contrast agents due to a combination of favorable superparamagnetic properties, biodegradability, and surface properties of easy modification for improved in vivo kinetics and multifunctionality. This review discusses the basics of MR imaging, the origin of SPION's unique magnetic properties, recent developments in MRI acquisition methods for detection of SPIONs, synthesis and post-synthesis processes that improve SPION's imaging characteristics, and an outlook on the translational potential of SPIONs.


Figures

Fig. 1
Fig. 1
The effects of an external magnetic field on bulk magnetite (top), Fe ions (middle) and SPIONs (bottom). Before application of the magnetic field all magnetic moments are randomly aligned. Application of an external magnetic field aligns the moments along the z-axis of the magnetic field. The initial net magnetization of SPIONs is greater than Fe ions, but less than bulk magnetite. Upon removal of the magnetic field, the moments of bulk magnetite remain fixed along z-axis while both Fe ions and SPIONs magnetic moments relax over time to equilibrium.
Fig. 2
Fig. 2
Comparison of the BBB permeating ability of Gd-DTPA and NPCP-CTX. A: T1-weighted MR images of N2:SmoA1 mice before and 5 min following the injection of Gd-DTPA. B: colorized R2 (1/T2) maps superimposed onto proton density–weighted images obtained before and 48 h following the injection of NPCP-CTX. C: T1-weighted MR images of N2:SmoA1 mice before and 5 min following the injection of Gd-DTPA obtained 48 h after NPCP-CTX administration. Arrows: blood vessels. (Reprinted with permission from, 2010 American Association Cancer Research.)
Fig. 3
Fig. 3
Signal variation among adjacent slices (a–c) from an in vivo 3T FSE 3D IRON acquisition obtained in an ischemic rabbit hindlimb with two injection sites of SPION-labeled stem cells (250,000 dotted white arrow, 125,000 solid white arrow). Excellent background suppression leads to clear visualization of stem cell injection sites with positive contrast and a larger volume of hyperintense signal for the 250,000-cell injection site. The dashed white arrow indicates imperfections in both on-resonant water suppression and off-resonant fat suppression. (Reprinted with permission from, 2007 John Wiley & Sons.)
Fig. 4
Fig. 4
Nanoscale size effect of water soluble iron oxide nanocrystals on magnetism and induced MR signals. (a) TEM images of Fe3O4 nanocrystals of 4, 6, 9, and 12 nm. (b) Size-dependent T2-weighted MR images of nanocrystals in aqueous solution at 1.5 T. (c) Size-dependent changes in color-coded MR images based on T2 values. (d) Graph of T2 value versus nanocrystal size. (e) Magnetization of nanocrystals measured by a SQUID magnetometer. (Reprinted with permission from, 2005 American Chemical Society.)
Fig. 5
Fig. 5
MR anatomical image of a mouse in the coronal plane (a) with the dotted line displaying the approximate location of the axial cross sections displayed in (c) and (d). Anatomical image in the (b) sagittal plane displaying the location of the 9L xenograft tumor (white arrow). Change in r2 relaxivity values for the tumor regions for mouse receiving (c) non-targeting NP-PEG-SIA and (d) targeting NP-PEG-CTX 3h post-injection. (Reprinted with permission from. 2008 American Chemical Society.)
Fig. 6
Fig. 6
Histology analysis of C6 xenograft tumors showing NP distribution. (a) Prussian blue stained sections of tumors from mice treated with nontargeted (NP:DNA) and targeted (NP:DNA-CTX) nanovectors. Scale bar corresponds to 20 μm. (b) Images of Prussian blue stained sections at high magnification for better visualization of nanovector localization. The non-targeted NP:DNA treated tissue clearly shows more intense blue signal (indicating greater clustering) than the targeted NP:DNA-CTX treated tissue. Scale bar corresponds to 5 μm. (Reprinted with permission from. 2010 American Chemical Society.)
Fig. 7
Fig. 7
Ex vivo optical imaging and in vivo MR imaging of brain tumors for a mouse treated with Cy5.5 labeled SPIONs (left) and an untreated mouse (right). Optical spectrum gradient bar corresponds to increasing fluorescent intensity. Color gradient bar for MR images corresponds to increasing r2 values. (Adapted with permission from, 2010 American Association Cancer Research.)

Similar articles

Cited by

References

    1. Edelman RD, et al. MRI: Clinical Magnetic Resonance Imaging. 2 ed W. B. Saunders Company; Philadelphia, Pennsylvania: 1996. p. 1150.
    1. Ferrari M. Nat Rev Cancer. 2005;5(3):161. - PubMed
    1. Wickline SA, et al. Journal of Magnetic Resonance Imaging. 2007;25(4):667. - PubMed
    1. Corot C, et al. Invest. Radiol. 2004;39(10):619. - PubMed
    1. Sun C, et al. Advanced Drug Delivery Reviews. 2008;60(11):1252. - PMC - PubMed

LinkOut - more resources