

Metabolic and proteomic profiling of diapause in the aphid parasitoid Praon volucre
- PMID: 22389713
- PMCID: PMC3289662
- DOI: 10.1371/journal.pone.0032606
Metabolic and proteomic profiling of diapause in the aphid parasitoid Praon volucre
Abstract
Background: Diapause, a condition of developmental arrest and metabolic depression exhibited by a wide range of animals is accompanied by complex physiological and biochemical changes that generally enhance environmental stress tolerance and synchronize reproduction. Even though some aspects of diapause have been well characterized, very little is known about the full range of molecular and biochemical modifications underlying diapause in non-model organisms.
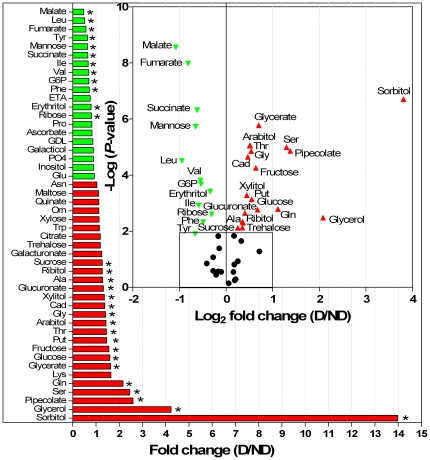
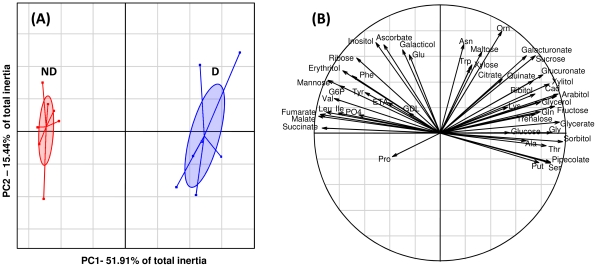
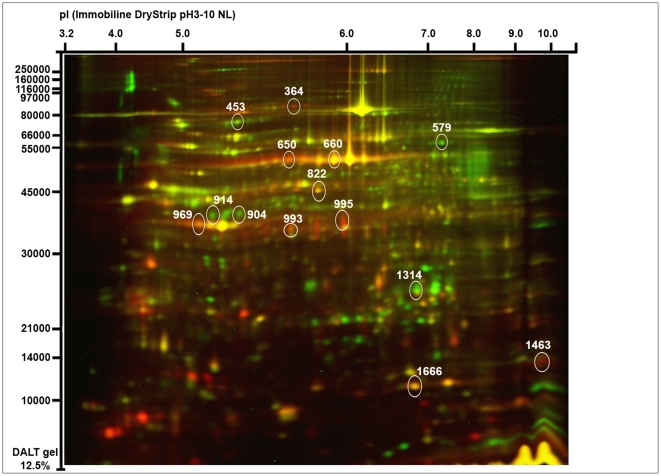
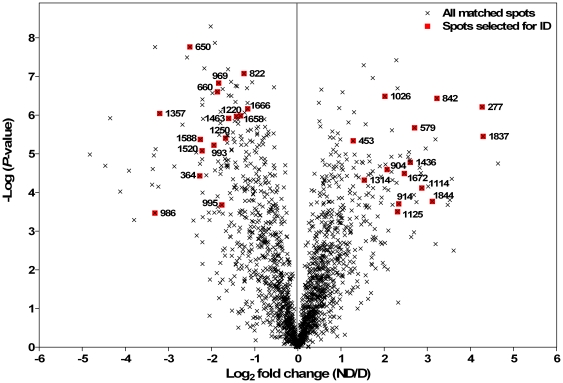
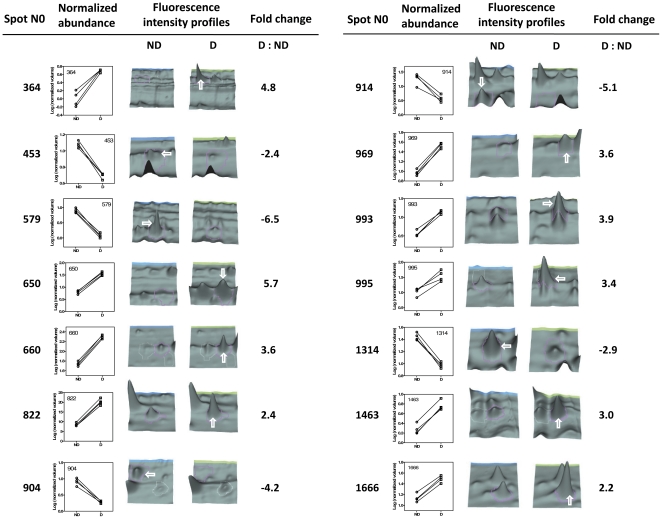
Methodology/principal findings: In this study we focused on the parasitic wasp, Praon volucre that exhibits a pupal diapause in response to environmental signals. System-wide metabolic changes occurring during diapause were investigated using GC-MS metabolic fingerprinting. Moreover, proteomic changes were studied in diapausing versus non-diapausing phenotypes using a combination of two-dimensional differential gel electrophoresis (2D-DIGE) and mass spectrometry. We found a reduction of Krebs cycle intermediates which most likely resulted from the metabolic depression. Glycolysis was galvanized, probably to favor polyols biosynthesis. Diapausing parasitoids accumulated high levels of cryoprotective polyols, especially sorbitol. A large set of proteins were modulated during diapause and these were involved in various functions such as remodeling of cytoskeleton and cuticle, stress tolerance, protein turnover, lipid metabolism and various metabolic enzymes.
Conclusions/significance: The results presented here provide some first clues about the molecular and biochemical events that characterize the diapause syndrome in aphid parasitoids. These data are useful for probing potential commonality of parasitoids diapause with other taxa and they will help creating a general understanding of diapause underpinnings and a background for future interpretations.
Conflict of interest statement
Figures
Similar articles
-
Deciphering the metabolic changes associated with diapause syndrome and cold acclimation in the two-spotted spider mite Tetranychus urticae.PLoS One. 2013;8(1):e54025. doi: 10.1371/journal.pone.0054025. Epub 2013 Jan 17. PLoS One. 2013. PMID: 23349779 Free PMC article.
-
Proteomic profiling of aphid Macrosiphum euphorbiae responses to host-plant-mediated stress induced by defoliation and water deficit.J Insect Physiol. 2007 Jun;53(6):601-11. doi: 10.1016/j.jinsphys.2007.02.018. Epub 2007 Mar 12. J Insect Physiol. 2007. PMID: 17466324
-
Intraspecific maternal competition induces summer diapause in insect parasitoids.Insect Sci. 2018 Dec;25(6):1080-1088. doi: 10.1111/1744-7917.12491. Epub 2017 Aug 8. Insect Sci. 2018. PMID: 28618174
-
Diapause hormone in the Helicoverpa/Heliothis complex: A review of gene expression, peptide structure and activity, analog and antagonist development, and the receptor.Peptides. 2015 Oct;72:196-201. doi: 10.1016/j.peptides.2015.05.005. Epub 2015 May 29. Peptides. 2015. PMID: 26032331 Review.
-
Endocrine Regulation of Lifespan in Insect Diapause.Front Physiol. 2022 Feb 15;13:825057. doi: 10.3389/fphys.2022.825057. eCollection 2022. Front Physiol. 2022. PMID: 35242054 Free PMC article. Review.
Cited by
-
An Overview of Ovarian Calyx Fluid Proteins of Toxoneuron nigriceps (Viereck) (Hymenoptera: Braconidae): An Integrated Transcriptomic and Proteomic Approach.Biomolecules. 2023 Oct 19;13(10):1547. doi: 10.3390/biom13101547. Biomolecules. 2023. PMID: 37892230 Free PMC article.
-
Comparative physiological plasticity to desiccation in distinct populations of the malarial mosquito Anopheles coluzzii.Parasit Vectors. 2016 Nov 2;9(1):565. doi: 10.1186/s13071-016-1854-1. Parasit Vectors. 2016. PMID: 27806730 Free PMC article.
-
Transcriptional Regulation of Reproductive Diapause in the Convergent Lady Beetle, Hippodamia convergens.Insects. 2022 Mar 31;13(4):343. doi: 10.3390/insects13040343. Insects. 2022. PMID: 35447785 Free PMC article.
-
Suppression of the gene encoding PDZ domain-containing protein decreases cold tolerance and overwintering survival of the mosquito, Culex pipiens (Culicidae: Diptera).J Med Entomol. 2023 Jul 12;60(4):690-697. doi: 10.1093/jme/tjad059. J Med Entomol. 2023. PMID: 37235642 Free PMC article.
-
The Critical Impact of Sub- and Supraoptimal Temperatures on Male Fertility Potential of an Invasive Fruit Fly.Ecol Evol. 2025 Jun 4;15(6):e71515. doi: 10.1002/ece3.71515. eCollection 2025 Jun. Ecol Evol. 2025. PMID: 40475867 Free PMC article.
References
-
- Tauber MJ, Tauber CA, Masaki S. Seasonal Adaptations of Insects. New York: Oxford University Press; 1986. 411
-
- Hodkova M, Hodek I. Photoperiod, diapause and cold-hardiness. Eur J Entomol. 2004;101:445–458.
-
- Denlinger DL. Regulation of diapause. Annu Rev Entomol. 2002;47:93–122. - PubMed
-
- Kostal V. Eco-physiological phases of insect diapause. J Insect Physiol. 2006;52:113–127. - PubMed
Publication types
MeSH terms
Substances
LinkOut - more resources
Full Text Sources
Miscellaneous
