. 2012;7(2):e32700.
doi: 10.1371/journal.pone.0032700. Epub 2012 Feb 28.

Adipocyte-specific protein tyrosine phosphatase 1B deletion increases lipogenesis, adipocyte cell size and is a minor regulator of glucose homeostasis

Affiliations

Adipocyte-specific protein tyrosine phosphatase 1B deletion increases lipogenesis, adipocyte cell size and is a minor regulator of glucose homeostasis

Carl Owen et al. PLoS One. 2012.

Abstract

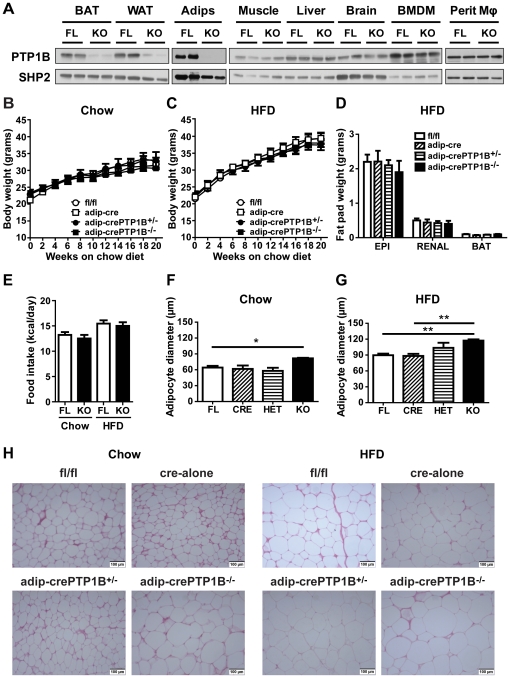
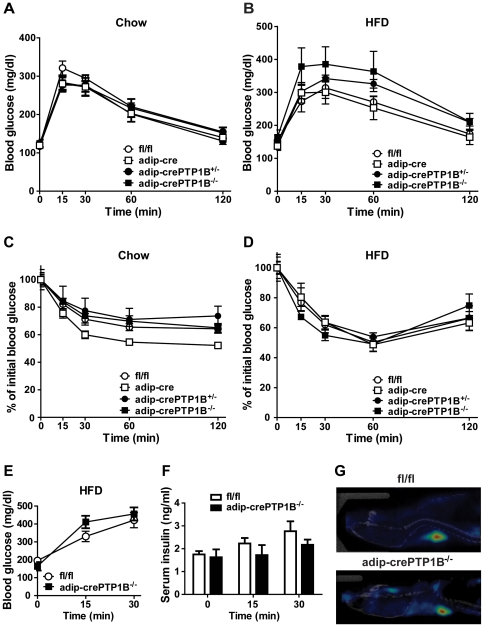
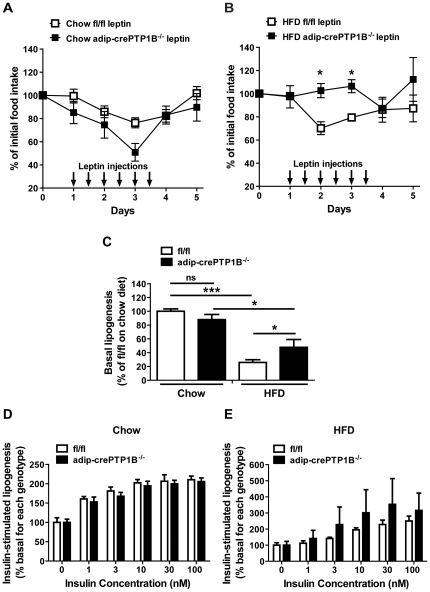
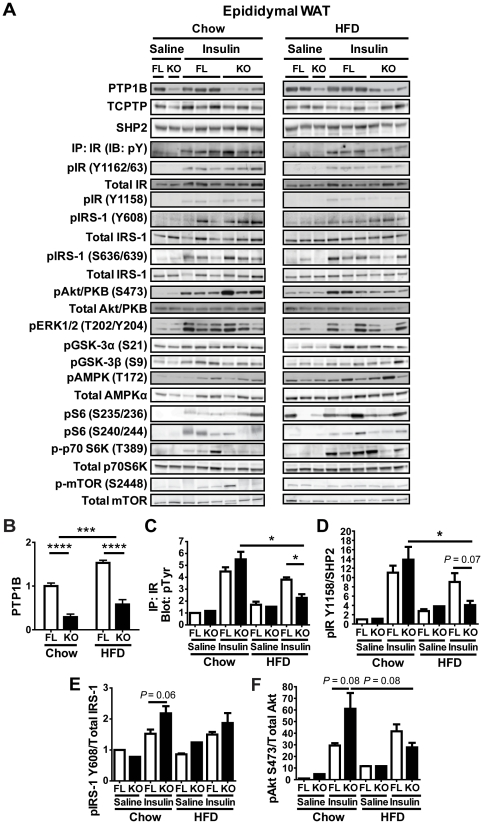
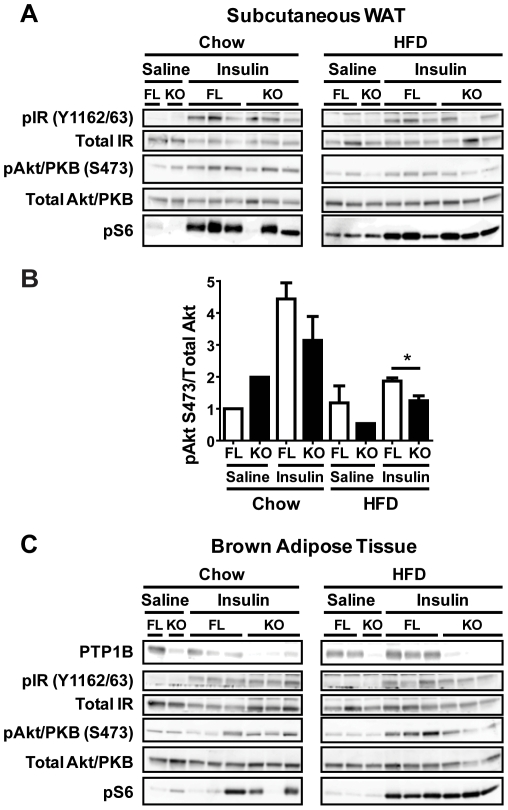
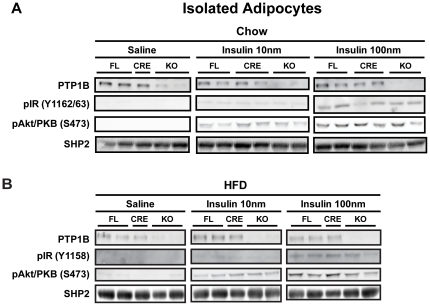
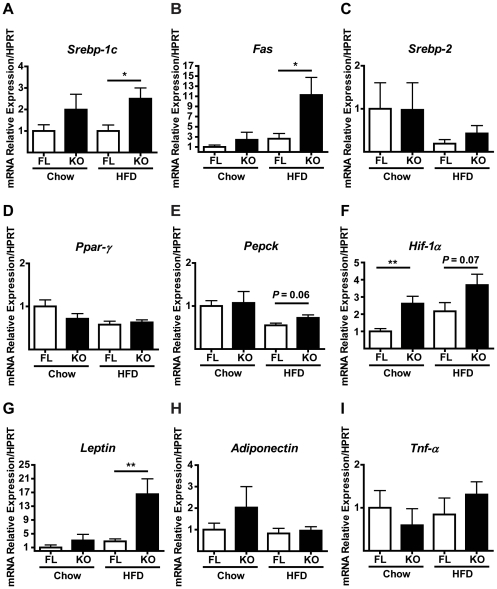
Protein tyrosine phosphatase 1B (PTP1B), a key negative regulator of leptin and insulin signaling, is positively correlated with adiposity and contributes to insulin resistance. Global PTP1B deletion improves diet-induced obesity and glucose homeostasis via enhanced leptin signaling in the brain and increased insulin signaling in liver and muscle. However, the role of PTP1B in adipocytes is unclear, with studies demonstrating beneficial, detrimental or no effect(s) of adipose-PTP1B-deficiency on body mass and insulin resistance. To definitively establish the role of adipocyte-PTP1B in body mass regulation and glucose homeostasis, adipocyte-specific-PTP1B knockout mice (adip-crePTP1B(-/-)) were generated using the adiponectin-promoter to drive Cre-recombinase expression. Chow-fed adip-crePTP1B(-/-) mice display enlarged adipocytes, despite having similar body weight/adiposity and glucose homeostasis compared to controls. High-fat diet (HFD)-fed adip-crePTP1B(-/-) mice display no differences in body weight/adiposity but exhibit larger adipocytes, increased circulating glucose and leptin levels, reduced leptin sensitivity and increased basal lipogenesis compared to controls. This is associated with decreased insulin receptor (IR) and Akt/PKB phosphorylation, increased lipogenic gene expression and increased hypoxia-induced factor-1-alpha (Hif-1α) expression. Adipocyte-specific PTP1B deletion does not beneficially manipulate signaling pathways regulating glucose homeostasis, lipid metabolism or adipokine secretion in adipocytes. Moreover, PTP1B does not appear to be the major negative regulator of the IR in adipocytes.


Conflict of interest statement

Competing Interests: The authors have declared that no competing interests exist.

Figures

Figure 1
Figure 1. Adipocyte-specific deletion of PTP1B has no effect on body mass, adiposity or food intake.
A: Deletion efficiency of PTP1B in fl/fl controls (FL) and adip-crePTP1B−/− mice (KO), as detected by immunoblotting. Tissues shown, (left to right) are brown adipose tissue (BAT), white adipose tissue (WAT), isolated adipocytes (Adips), muscle, liver, brain, bone marrow derived macrophages (BMDM) and intraperitoneal macrophages (Perit Mϕ). B: Weight curves for fl/fl (n = 14), adip-cre (n = 6), adip-crePTP1B+/− (n = 5) and adip-crePTP1B−/− mice (n = 4) on chow diet for 21 weeks from weaning. C: Weight curves for fl/fl (n = 13), adip-cre (n = 6), adip-crePTP1B+/− (n = 5) and adip-crePTP1B−/− mice (n = 4) on HFD diet for 21 weeks. D: Fat pad weight of mice on HFD for 21 weeks. Tissues shown, (left to right) are epididymal (EPI), peri-renal (RENAL) and brown adipose tissue (BAT). Fl/fl (n = 13); adip-cre (n = 6); adip-crePTP1B+/− (n = 5); adip-crePTP1B−/− (n = 4). E: Daily food intake of mice on chow or HFD. fl/fl (FL) (chow n = 5, HFD n = 7); adip-crePTP1B−/− (KO) (chow n = 4, HFD n = 5). F: Increased epididymal adipocyte cell size in chow-fed adip-crePTP1B−/− mice (KO) compared with adip-crePTP1B+/− mice (HET), fl/fl (FL) and cre-alone controls (CRE). G: Increased epididymal adipocyte cell size in HFD-fed adip-crePTP1B−/− mice (KO) compared with adip-crePTP1B+/− mice (HET), fl/fl and cre-alone controls (FL/CRE). H: Hematoxylin and eosin stained epididymal white adipose tissue of mice on chow or HFD diet for 21 weeks. n = 4 mice/group. White circles = fl/fl; white squares = adip-cre; black circles = adip-crePTP1B+/−; black squares = adip-crePTP1B−/−. White bars = fl/fl; diagonally striped bars = adip-cre; horizontally striped bars = adip-crePTP1B+/−; black bars = adip-crePTP1B−/−. Data are represented as mean ± SEM. Data were analyzed using two-tailed Student's t test (**P<0.01).
Figure 2
Figure 2. Glucose homeostasis in adipocyte-specific PTP1B knockout mice.
A: GTT (2 mg/g glucose) of mice on chow diet for 20 weeks from weaning fl/fl (n = 6); adip-cre (n = 6); adip-crePTP1B+/− (n = 5); adip-crePTP1B−/− (n = 3). B: GTT (1.5 mg/g glucose) of mice on HFD for 19 weeks. fl/fl (n = 7); adip-cre (n = 6); adip-crePTP1B+/− (n = 5); adip-crePTP1B−/− (n = 4). C: ITT (Insulin 0.6 mU/g body weight) of mice on chow diet for 21 weeks from weaning. fl/fl (n = 8); adip-cre (n = 6); adip-crePTP1B+/− (n = 5); adip-crePTP1B−/− (n = 4). D: ITT (Insulin 1.1 mU/g body weight) of mice on HFD for 20 weeks fl/fl (n = 8); adip-cre (n = 6); adip-crePTP1B+/− (n = 5); adip-crePTP1B−/− (n = 4). E: GTT (1.5 mg/g) of mice on HFD. fl/fl (n = 5); adip-crePTP1B−/− (n = 5). Glucose-stimulated insulin secretion of HFD-fed mice during GTT. fl/fl (n = 5); adip-crePTP1B−/− (n = 5). G: Representative PET scan image from fl/fl (top panel) and adip-crePTP1B−/− (bottom panel) mice. White circles = fl/fl; white squares = adip-cre; black circles = adip-crePTP1B+/−; black squares = adip-crePTP1B−/−. White bars = fl/fl; black bars = adip-crePTP1B−/−. Data are represented as mean ± SEM.
Figure 3
Figure 3. Decreased leptin sensitivity and increased lipogenesis in HFD-fed adip-crePTP1B−/− mice.
A: Leptin sensitivity, as measured by the percentage change in food intake after leptin administration in chow-fed adip-crePTP1B−/− (n = 5) and fl/fl control mice (n = 5). B: Leptin sensitivity in HFD-fed adip-crePTP1B−/− (n = 3) and fl/fl control mice (n = 3). C: Basal lipogenesis in chow and HFD-fed adip-crePTP1B−/− (n = 3) and fl/fl control mice (n = 3). D: Insulin-stimulated lipogenesis of chow-fed adip-crePTP1B−/− (n = 4) and fl/fl control mice (n = 4). E: Insulin-stimulated lipogenesis of HFD-fed adip-crePTP1B−/− (n = 3) and fl/fl control mice (n = 3). White squares = chow fl/fl leptin; white triangles = HFD fl/fl leptin; black squares = chow adip-crePTP1B−/− leptin; black triangles = HFD adip-crePTP1B−/− leptin. White bars = fl/fl; black bars = adip-crePTP1B−/−. Data are represented as mean ± SEM; Data were analyzed using a two-way ANOVA with Bonferroni multiple comparisons post-tests (*P≤0.05; ***P<0.001).
Figure 4
Figure 4. Reduced in vivo insulin signaling in epididymal white adipose tissue from HFD-fed adip-crePTP1B−/− mice.
A: Epididymal white adipose tissue immunoblots of insulin signaling components in chow- and HFD-fed fl/fl and adip-crePTP1B−/− (KO) and fl/fl (FL) mice after injection with saline or insulin (10 mU/kg). B: PTP1B levels and deletion efficiency of fl/fl (n = 4–5) and adip-crePTP1B−/− mice (n = 4) in epididymal white adipose tissue under chow- and HFD-fed conditions. Graphs C to F show phosphorylation levels of the indicated proteins in epididymal white adipose tissue after saline or insulin (10 mU/kg) injection of chow- or HFD-fed fl/fl and adip-crePTP1B−/− mice, as indicated. Phosphorylated proteins were normalized as shown in the graphs. C: IP: IR (IB: pY). D: IR Y1158. E: IRS-1 Y608. F: Akt/PKB S473. White bar = fl/fl; black bar = adip-crePTP1B−/−. Data are represented as mean ± SEM; data were analyzed using two-way ANOVA with Bonferroni multiple comparisons post-tests to compare between diets, and two-tailed Student's t test to compare between different genotypes on the same diet (*P<0.05; **P<0.01; ***P<0.001; ****P<0.0001).
Figure 5
Figure 5. Reduced in vivo insulin signaling in subcutaneous white adipose tissue from HFD-fed adip-crePTP1B−/− mice.
A: Subcutaneous white adipose tissue immunoblots of insulin signaling components in chow- and HFD-fed fl/fl and adip-crePTP1B−/− (KO) and fl/fl (FL) mice after injection with saline or insulin (10 mU/kg). B: Akt/PKB S473 phosphorylation levels normalized to total Akt/PKB in subcutaneous white adipose tissue after saline or insulin (10 mU/kg) injection of chow- or HFD-fed fl/fl (FL) and adip-crePTP1B−/− mice (KO). C: Brown adipose tissue immunoblots of insulin signaling components in chow- and HFD-fed fl/fl and adip-crePTP1B−/− (KO) and fl/fl (FL) mice after injection with saline or insulin (10 mU/kg). White bar = fl/fl; black bar = adip-crePTP1B−/−. Data are represented as mean ± SEM; data were analyzed using two-tailed Student's t test (*P<0.05; **P<0.01).
Figure 6
Figure 6. No effect of adipocyte-PTP1B deletion on insulin signaling in isolated adipocytes.
A: Immunoblots of insulin-stimulated (0 nM, 10 nM or 100 nM insulin) isolated epididymal adipocytes from chow-fed control and adip-crePTP1B−/− mice. B: Immunoblots of insulin-stimulated (0 nM, 10 nM or 100 nM insulin) isolated epididymal adipocytes from HFD-fed control and adip-crePTP1B−/− mice.
Figure 7
Figure 7. Increased lipogenic gene expression in HFD-fed adip-crePTP1B−/− mice.
Graphs A to I show relative mRNA levels of the indicated genes in epididymal WAT, measured by quantitative real-time PCR and normalized against Hprt mRNA. Chow-fed adip-crePTP1B−/− (n = 4) and chow-fed fl/fl control mice (n = 13) were compared to HFD-fed adip-crePTP1B−/− (n = 4) and HFD-fed fl/fl control mice (n = 15). A: Srebp-1c. B: Fas. C: Srebp-2. D: Ppar-γ. E: Pepck. F: Hif-1α. G: Leptin. H: Adiponectin. I: Tnf-α. White bar = fl/fl; black bar = adip-crePTP1B−/−. Data are represented as mean ± SEM; data were analyzed using two-tailed Student's t test (*P<0.05; **P<0.01).

Similar articles

Cited by

References

    1. Biddinger S, Kahn C. From mice to men: insights into the insulin resistance syndromes. Annu Rev Physiol. 2006;68:123–158. - PubMed
    1. Unger R. Lipotoxicity in the pathogenesis of obesity-dependent NIDDM. Genetic and clinical implications. Diabetes. 1995;44:863–870. - PubMed
    1. Herman MA, Kahn BB. Glucose transport and sensing in the maintenance of glucose homeostasis and metabolic harmony. J Clin Invest. 2006;116:1767–1775. - PMC - PubMed
    1. Rosen ED, Spiegelman BM. Adipocytes as regulators of energy balance and glucose homeostasis. Nature. 2006;444:847–853. - PMC - PubMed
    1. Delibegovic M, Zimmer D, Kauffman C, Rak K, Hong E, et al. Liver-specific deletion of protein-tyrosine phosphatase 1B (PTP1B) improves metabolic syndrome and attenuates diet-induced endoplasmic reticulum stress. Diabetes. 2009;58:590–599. - PMC - PubMed

Publication types

MeSH terms

Substances