. 2012 Mar 5:6:14.
doi: 10.1186/1752-0509-6-14.

Simplification of biochemical models: a general approach based on the analysis of the impact of individual species and reactions on the systems dynamics

Affiliations

Simplification of biochemical models: a general approach based on the analysis of the impact of individual species and reactions on the systems dynamics

Irina Surovtsova et al. BMC Syst Biol. .

Abstract

Background: Given the complex mechanisms underlying biochemical processes systems biology researchers tend to build ever increasing computational models. However, dealing with complex systems entails a variety of problems, e.g. difficult intuitive understanding, variety of time scales or non-identifiable parameters. Therefore, methods are needed that, at least semi-automatically, help to elucidate how the complexity of a model can be reduced such that important behavior is maintained and the predictive capacity of the model is increased. The results should be easily accessible and interpretable. In the best case such methods may also provide insight into fundamental biochemical mechanisms.

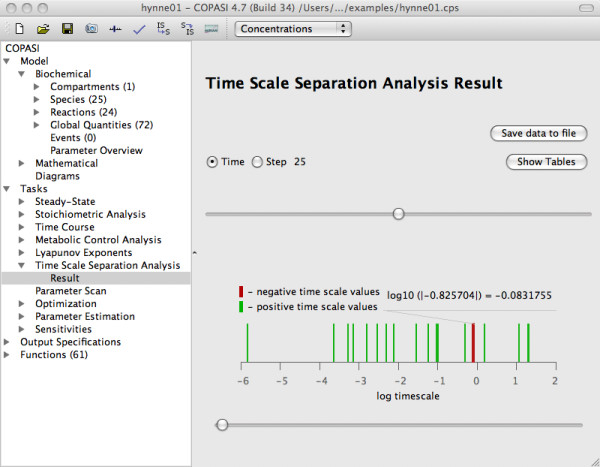
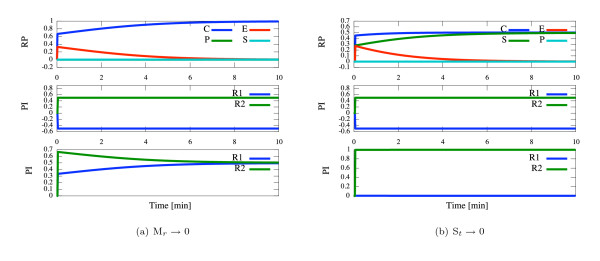
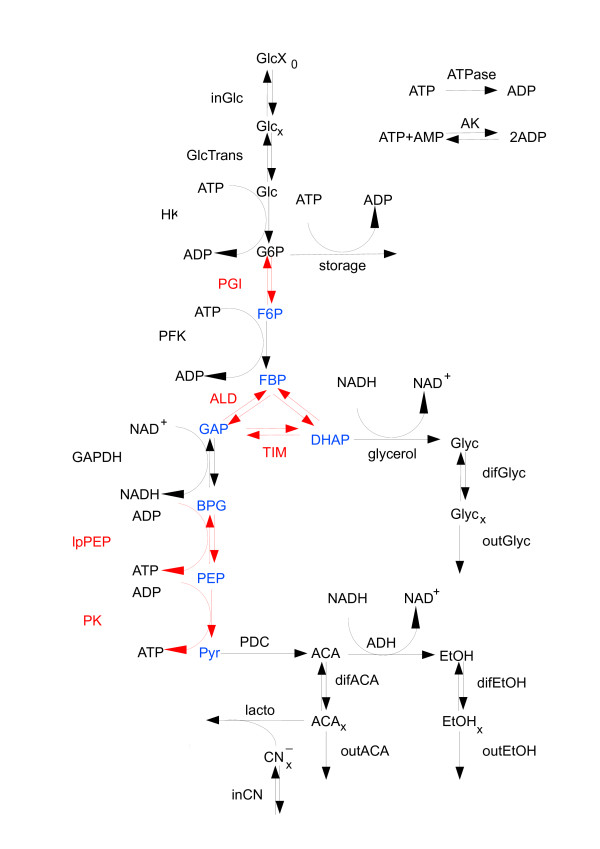
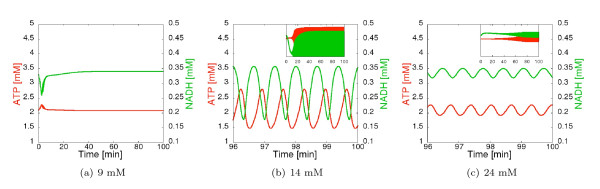
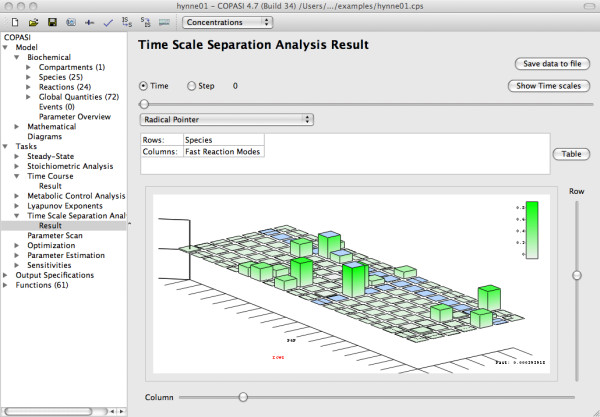
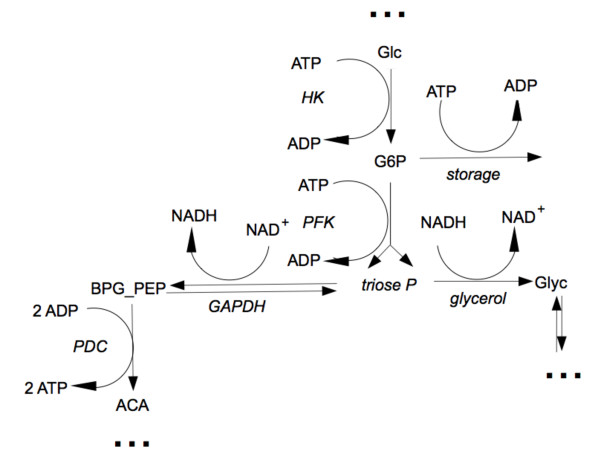
Results: We have developed a strategy based on the Computational Singular Perturbation (CSP) method which can be used to perform a "biochemically-driven" model reduction of even large and complex kinetic ODE systems. We provide an implementation of the original CSP algorithm in COPASI (a COmplex PAthway SImulator) and applied the strategy to two example models of different degree of complexity - a simple one-enzyme system and a full-scale model of yeast glycolysis.

Conclusion: The results show the usefulness of the method for model simplification purposes as well as for analyzing fundamental biochemical mechanisms. COPASI is freely available at http://www.copasi.org.


Figures

Figure 1
Figure 1
COPASI visualization of the time scale distribution. Full glycolysis model of Hynne et al. [16], [Glcx]0 = 14 mM, t = 25 min. The coincident bars on the graph correspond to equal time scales.
Figure 2
Figure 2
Michaelis Menten model. Left: Mr → 0 (S0 = 100; E0 = 1; k1 = 1; k-1 = k2 = 100). Right: St → 0 (S0 = 100; E0 = 100; k1 = k-1 = 100; k2 = 1). Time evolution of the Radical Pointer (RP) in the fast mode (top), Participation Indexes (PI) of reactions R1 and R2 in the fast (middle) and slow mode (bottom). The RP of product P in the first case Mr → 0 is similar to RP of substrate S (the both lines overlaid).
Figure 3
Figure 3
Reaction scheme for the glycolysis model of S. cerevisiae. Fast reactions are marked in red, reduced (or lumped) metabolites in blue.
Figure 4
Figure 4
Simulated time courses of [ATP] and [NADH] in the three different dynamic regimes at concentrations of [Glcx]0 from time t = 0 min to t = 100 min. In Figure (b), (c) the subinterval from t = 96 min is drawn to a larger scale.
Figure 5
Figure 5
Time evolution of the time scales 15 to 18 in the three dynamic regimes (a)-(c) at concentrations of [Glcx]0 from time t = 0 min to t = 100 min. In Figure (b), (c) the subinterval from t = 96 min is drawn to a larger scale. (d) Time evolution of the number of fast modes M in the three different dynamic regimes.
Figure 6
Figure 6
COPASI bar graph visualization of the Radical Pointers. Full glycolysis model of [16], [Glcx]0 = 24 at time t = 0. The 3D columns display the values of Radical Pointer as bars. One bar corresponds to one species (row) and one fast reaction mode (column).
Figure 7
Figure 7
The time evolution of the normed sum of Participation Indexes (PI) for vlpPEP (a), vPFK (b), vGlcTrans (c) and voutACA (d). Upper, middle and lower panel relate to [Glcx]0 = 9 mM, 14 mM and 24 mM, respectively. Blue and green curves show the contribution to the entire fast and slow subspace, respectively.
Figure 8
Figure 8
Modified part of the reaction scheme for the reduced glycolysis model of S. cerevisiae.
Figure 9
Figure 9
Time courses of [ATP] and [NADH] in the two oscillating regimes at concentrations of [Glcx]0 as indicated. The upper diagrams show the simulation of the full model, the lower the ones of the reduced system.

References

    1. Hübner K, Sahle S, Kummer U. Applications and trends in systems biology in biochemistry. FEBS Journal. 2011;278:2767–2857. doi: 10.1111/j.1742-4658.2011.08217.x. - DOI - PubMed
    1. Okino MS, Mavrovouniotis ML. simplification of mathematical models of chemical reaction systems. Chemical Reviews. 1998;98:391–408. doi: 10.1021/cr950223l. - DOI - PubMed
    1. Schuster S, Pfeiffer T, Moldenhauer F, Koch I, Dandekar T. Exploring the pathway structure of metabolism: decomposition into subnetworks and application to Mycoplasma pneumoniae. Bioinformatics. 2002;18:351–361. doi: 10.1093/bioinformatics/18.2.351. - DOI - PubMed
    1. Kauffman K, Pajerowski J, Jamshidi N, Palsson BO, Edwards J. Description and analysis of metabolic connectivity and dynamics in the human red blood cell. Biophysical Journal. 2002;83:646–662. doi: 10.1016/S0006-3495(02)75198-9. - DOI - PMC - PubMed
    1. Price ND, Reed JL, Papin JA, Famili I, Palsson BO. Analysis of metabolic capabilities using singular value decomposition of extreme pathway matrices. Biophysical Journal. 2003;84:794–804. doi: 10.1016/S0006-3495(03)74899-1. - DOI - PMC - PubMed

Publication types

LinkOut - more resources