. 2012 Mar 20;84(6):2883-91.
doi: 10.1021/ac203434x. Epub 2012 Mar 2.

Measuring markers of liver function using a micropatterned paper device designed for blood from a fingerstick

Affiliations

Measuring markers of liver function using a micropatterned paper device designed for blood from a fingerstick

Sarah J Vella et al. Anal Chem. .

Abstract

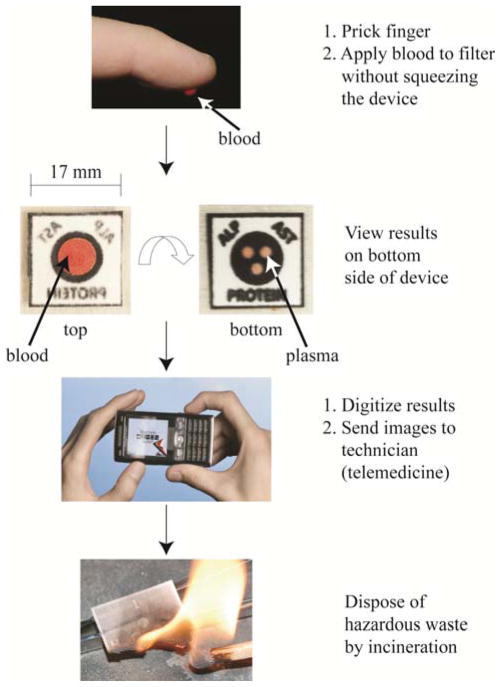
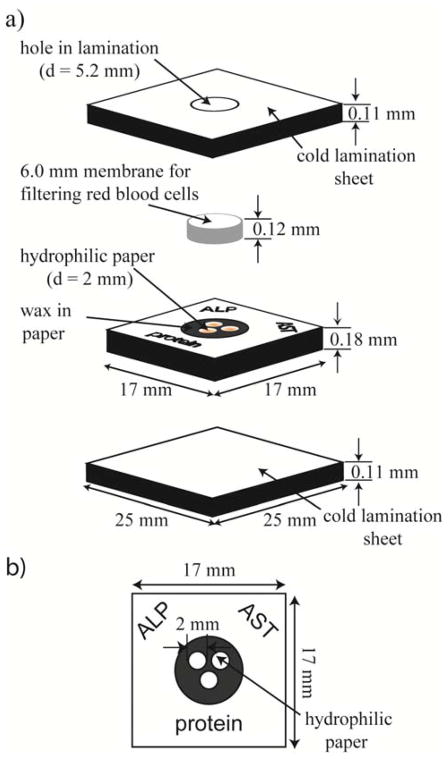
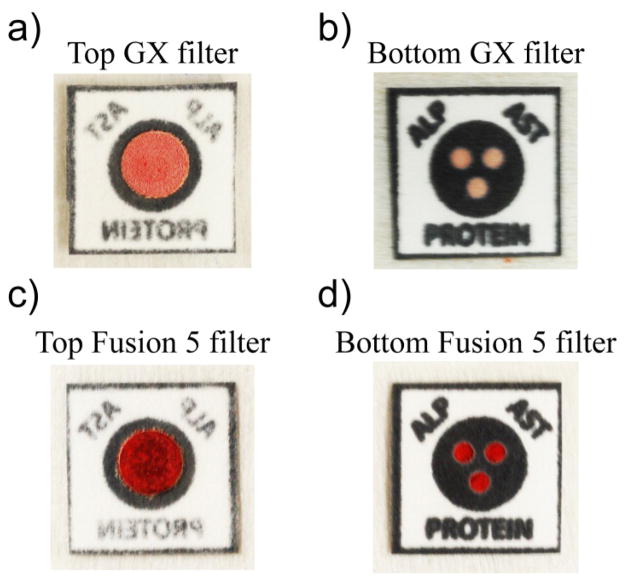
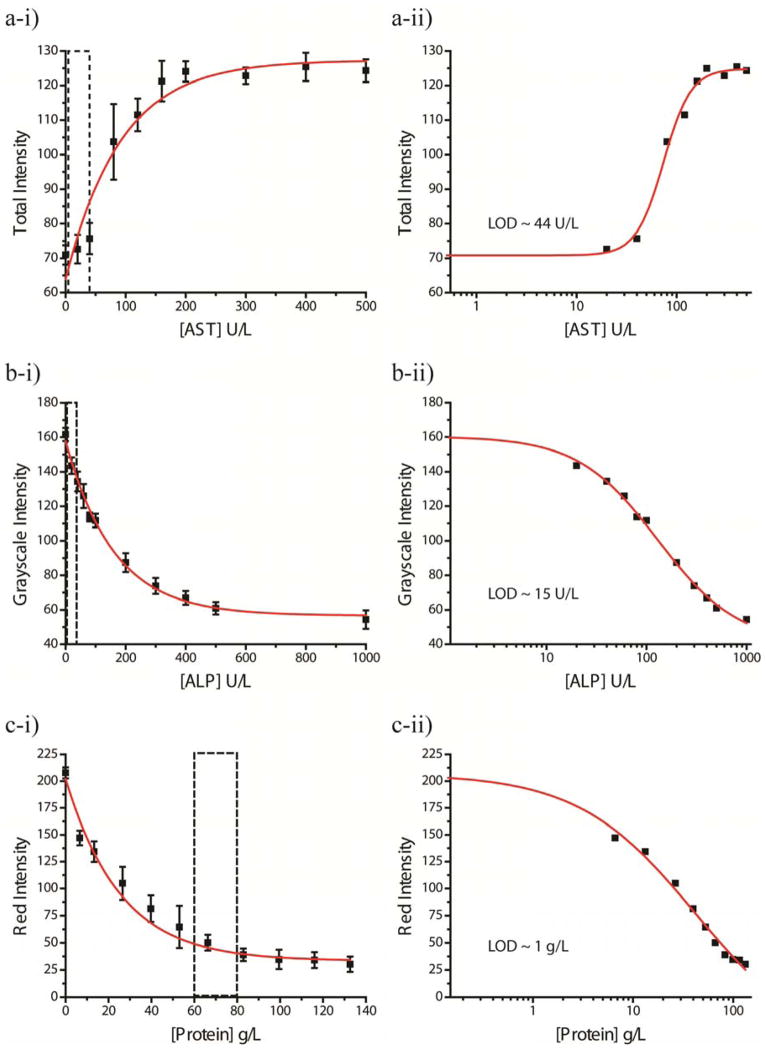
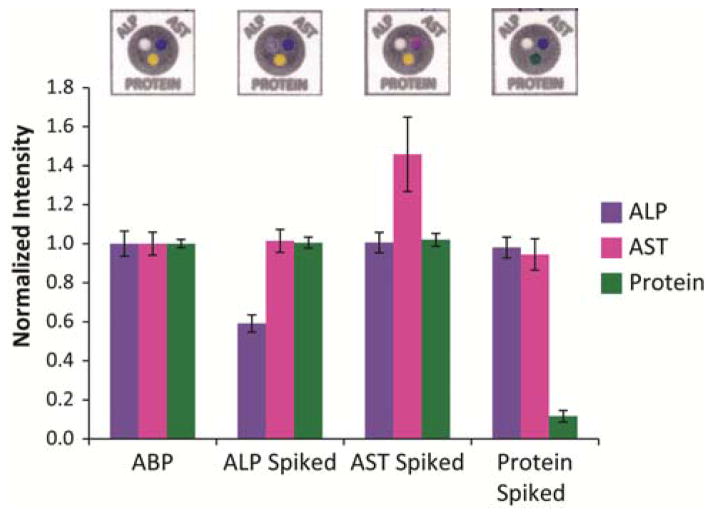
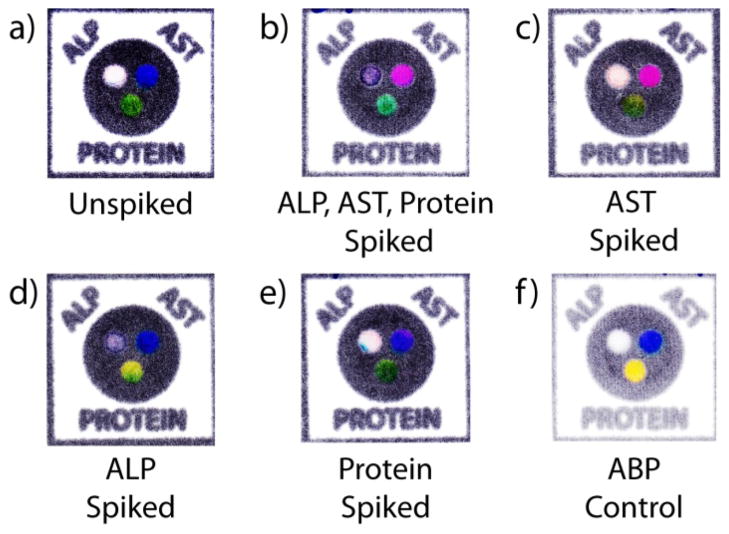
This paper describes a paper-based microfluidic device that measures two enzymatic markers of liver function (alkaline phosphatase, ALP, and aspartate aminotransferase, AST) and total serum protein. A device consists of four components: (i) a top plastic sheet, (ii) a filter membrane, (iii) a patterned paper chip containing the reagents necessary for analysis, and (iv) a bottom plastic sheet. The device performs both the sample preparation (separating blood plasma from erythrocytes) and the assays; it also enables both qualitative and quantitative analysis of data. The data obtained from the paper-microfluidic devices show standard deviations in calibration runs and "spiked" standards that are acceptable for routine clinical use. This device illustrates a type of test useable for a range of assays in resource-poor settings.


Figures

Figure 1
Figure 1
System designed for the quantitative measurement of analyte levels in a drop of blood. A small device fabricated from paper patterned with wax, a filter membrane, and a plastic sheath processes and analyzes a drop of blood from a fingerstick. The multifunctional device, encased in two self-adhesive laminating sheets, uses the paper to store the reagents for the assays, and the filter on top of the paper to separate plasma from the red blood cells. A cell phone or desktop scanner digitizes the results from the assays, which can be analyzed off-site by trained personnel. Incineration of the devices easily disposes the bio-hazardous waste.
Figure 2
Figure 2
Design of a vertical-flow device for detecting and quantifying i) the levels of total serum protein (Protein), ii) alkaline phosphatase (ALP), and iii) aspartate aminotransferase (AST) in blood obtained from a fingerstick. (a) An oblique view of the assembled device. The device comprises three inexpensive, lightweight, and readily available components: Fellows® single-sided, self-adhesive cold lamination sheets (the top and bottom sheets used to encase the paper holding the reaction zones), Whatman Grade 1 Chromatography paper (patterned to create three reaction zones), and a Pall plasma separation membrane (PSM) (Vivid GX PSM for filtering red blood cells). b) Paper patterned with three circular hydrophilic zones (d ~ 2 mm) surrounded by a hydrophobic wax barrier.
Figure 3
Figure 3
Images of two Liver Function Test (LFT) devices constructed with a Vivid GX PSM (top) and a Fusion 5 filter (bottom). Top: a) The topside of the GX PSM with adsorbed red blood cells. b) The bottom side of the GX PSM device showing all three hydrophilic zones wetted with blood plasma; this device passed as fully functional. Bottom: c) The topside of the Fusion 5 showing adsorbed red blood cells. d) The bottom side of the Fusion 5 device showing all three zones containing red blood cells; this device failed for ineffective plasma separation.
Figure 4
Figure 4
Calibration (left) and Limit of Detection (LOD) Curves (right) for a) AST, b) ALP, and c) Protein. The boxes outlined in dotted lines on the calibration curves indicate the normal range for each analyte. The total color intensity analyzed at 20 minutes for each concentration generated the AST calibration curve. Grayscale intensity analyzed at 30 minutes for each concentration generated the ALP calibration. Red intensity analyzed at 30 minutes for each concentration generated the Protein Calibration. The limits of detection were determined to be ~44 U/L, ~15 U/L, ~1 g/L for AST, ALP, and Protein, respectively.
Figure 5
Figure 5
Results from testing the cross-reactivity of the enzymes prepared in artificial blood plasma. Samples were prepared with sufficient quantities of one analyte (AST (780 U/L), ALP (1200 U/L), or BSA (150 g/L) to elicit a response in each assay. Analysis of each assay on the devices at the appropriate time and color channel determined the intensity of each analyte. Normalized intensities of each assay against the control ABP solution shows that each series of devices only elicited a response (i.e. an increase or decrease in intensity) between the analyte and their respective assay, indicating that each assay was specific for its analyte and that no cross-reactivity occurred.
Figure 6
Figure 6
Samples of devices tested using whole blood samples after 30 minutes. a) An unspiked sample from a fingerstick. A sample of whole blood spiked with sufficient quantities to elicit a response in each assay: b) all three analytes, c) AST only, d) ALP only, e) BSA only. f) A control with ABP without any analytes.

References

    1. Yager P, Domingo GJ, Gerdes J. Annu Rev Biomed Eng. 2008;10:107–144. - PubMed
    1. Kettler H, White K, Hawkes S. Mapping the landscape of diagnostics for sexually transmitted infections. World Health Organization; Geneva, SW: 2004. pp. 1–37.
    1. Mabey D, Peeling RW, Ustianowski A, Perkins MD. Nat Rev Microbiol. 2004;2:231–240. - PubMed
    1. Udea M, Penny LA, Olmsted SS, Giovanni MY, Kaspar P, Shepherd A, Wilson P, Dahl CASBGM, Burgess DCH. Nature. 2006;444:73–79. - PubMed
    1. Fitzgerald DW, Pape JW, Wasserheit JN, Counts GW, Corey L. The Lancet. 2003;362:993–994. - PubMed

Publication types