Review
. 2012 Jul;57(3):251-8.
doi: 10.1016/j.ymeth.2012.02.009. Epub 2012 Feb 25.

Cytometry: today's technology and tomorrow's horizons

Affiliations
Review

Cytometry: today's technology and tomorrow's horizons

Pratip K Chattopadhyay et al. Methods. 2012 Jul.

Abstract

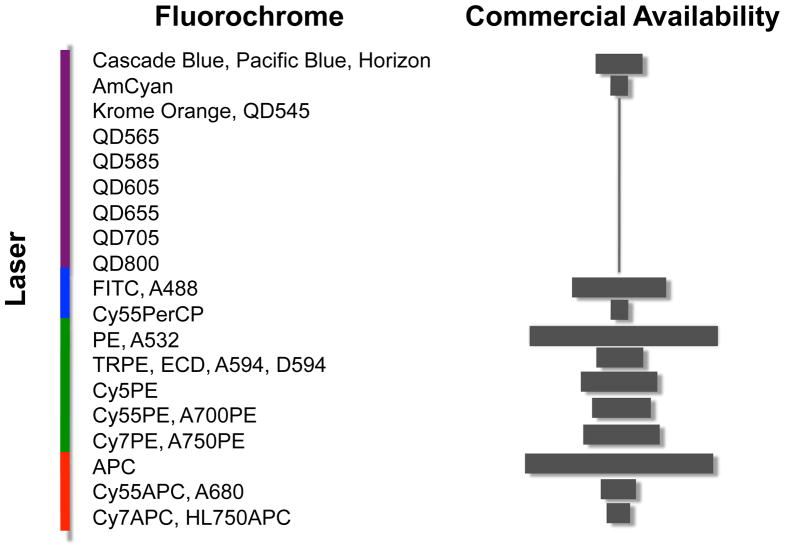
Flow cytometry has been the premier tool for single cell analysis since its invention in the 1960s. It has maintained this position through steady advances in technology and applications, becoming the main force behind interrogating the complexities of the immune system. Technology development was a three-pronged effort, including the hardware, reagents, and analysis algorithms to allow measurement of as many as 20 independent parameters on each cell, at tens of thousands of cells per second. In the coming years, cytometry technology will integrate with other techniques, such as transcriptomics, metabolomics, and so forth. Ongoing efforts are aimed at algorithms to analyse these aggregated datasaets over large numbers of samples. Here we review the development efforts heralding the next stage of flow cytometry.


Figures

Figure 1
Figure 1
A timeline illustrating coordinates advances in flow cytometry technology and understanding of the complexity of the T-cell compartment.
Figure 2
Figure 2. Bulk measurements introduce noise into assays, thereby reducing the power to detect populations with disease or vaccine relevance
For example, if the population that correlates strongly with a disease or vaccine outcome consists of IFNg+ IL2− TNF+ CD107a+ cells, the measurement of these four markers will reveal the correlation. However, if only three markers are measured, an irrelevant cell type is included (TNF- cells), introducing noise into the assays, and reducing the correlations. When additional markers are omitted, even more noise is introduced, further reducing the power to detect correlations.
Figure 3
Figure 3. Common fluorochromes used in flow cytometry, and the variety of reagents commercially available for each
Note the dearth of commercially available reagents that can be excited by the violet laser. Abbreviations for commercial fluorochromes: QD, quantum dot; A, Alexa (e.g., Alexa-488); Cy, Cyanine; PerCP, peridinin chlorophyll; PE, phycoerythrin; ECD, energy coupling dye (also known as PE-Texas Red); D, DyLight; HL, HiLyte.
Figure 4
Figure 4. Properties and applications of BV421
A) Schematic illustrating polymer structure of BV421, as conjugated to antibody. Energy from a violet laser (hva) excites electrons in the polymer and blue light (hve) is emitted. Excitation (purple) and emission spectra (blue) for BV421 are also shown. B) Staining patterns for BV421 (left), Pacific Blue (read on the same channel as BV421, middle), and PE (right) conjugates of anti-human CD8. C) Identification of CMV-NLV specific CD8+ T- cells using pMHCImultimers made with streptavidin-BV421 (left), -APC (middle), or –QD605 (right).
Figure 5
Figure 5. Fluidigm analysis of CD8+ T-cells specific for HLA-A2 NLV epitope of CMV
PBMC were stimulated with NLV peptide for three hours (without monensin or brefeldin A). Results are presented as a heat map, where each row represents the gene expression profile of a single cell (e.g., cell A and cell B, pink box), and each column represents the expression level of one of the assayed genes (e.g., transcript I and transcript T, pink arrows). Levels of each transcript are potted on a gray scale, from low expression (white) to high expression (black). To simplify presentation, individual gene names are not shown; instead, genes are grouped into modules, as indicated at the bottom of the figure. The final four columns in the map depict composite expression profiles, which show the total level of expression for all the measured transcripts (1), and for those transcripts associated with cellular activation (2), cytolysis (3), and cytokines (4), within each cell.

References

    1. Hulett HR, Bonner WA, Barrett J, Herzenberg LA. Cell sorting: automated separation of mammalian cells as a function of intracellular fluorescence. Science. 1969;166:747–749. - PubMed
    1. Wider ME, Cram LS. Differential fluorochromasia of human lymphocytes as measured by flow cytometry. J Histochem Cytochem. 1977;25:888–891. - PubMed
    1. Chattopadhyay PK, Roederer M. Good cell, bad cell: flow cytometry reveals T-cell subsets important in HIV disease. Cytometry A. 2010;77:614–622. - PMC - PubMed
    1. De Rosa SC, Herzenberg LA, Roederer M. 11-color, 13-parameter flow cytometry: identification of human naive T cells by phenotype, function, and T-cell receptor diversity. Nat Med. 2001;7:245–248. - PubMed
    1. De Rosa SC, et al. Vaccination in humans generates broad T cell cytokine responses. J Immunol. 2004;173:5372–5380. - PubMed

Substances