Enteral leucine supplementation increases protein synthesis in skeletal and cardiac muscles and visceral tissues of neonatal pigs through mTORC1-dependent pathways
- PMID: 22391631
- PMCID: PMC3619200
- DOI: 10.1038/pr.2011.79
Enteral leucine supplementation increases protein synthesis in skeletal and cardiac muscles and visceral tissues of neonatal pigs through mTORC1-dependent pathways
Abstract
Introduction: Leucine (Leu) activates mammalian target of rapamycin (mTOR) to upregulate protein synthesis (PS).
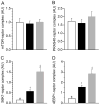
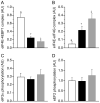
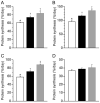
Results: PS in skeletal muscles, heart, liver, pancreas, and jejunum, but not kidney, were greater in low protein supplemented with Leu (LP+L) than LP, but lower than high protein (HP). In longissimus dorsi muscle, protein kinase B phosphorylation was similar in LP and LP+L, but lower than HP. Although less than HP, p70 ribosomal S6 kinase 1 (S6K1) and eukaryotic initiation factor (eIF) 4E binding protein 1 (4EBP1) association with regulatory associated protein of mammalian target of rapamycin was greater in LP+L than LP, resulting in higher S6K1 and 4EBP1 phosphorylation. Feeding LP+L vs. LP decreased 4EBP1·eIF4E and increased eIF4E·eIF4G formation, but not to HP. Similar results were obtained for S6K1 and 4EBP1 phosphorylation in gastrocnemius, masseter, heart, liver, pancreas, and jejunum, but not kidney. eIF2α and elongation factor 2 phosphorylation was unaffected by treatment. DICUSSION: Our results suggest that enteral Leu supplementation of a low protein diet enhances PS in most tissues through mTOR complex 1 pathways.
Methods: To examine enteral Leu effects on PS and signaling activation, 5-d-old piglets were fed for 24 h diets containing: (i) LP, (ii) LP+L, or (iii) HP.
Figures


 ) diets for 1530 min. Values are means + SEM, n = 7–10 per treatment. Means without a common symbol differ, p < 0.05.
 ) diets. Values are means + SEM, n = 7–10 per treatment. Means without a common symbol differed, p < 0.05.
 ) diets. Values are means + SEM, n = 7–10 per treatment. Means without a common symbol differed, P < 0.05.
 ) diets. Values are means + SEM, n = 7–10 per treatment. Means without a common symbol differed, p < 0.05.
 ) diets. Values are means + SEM, n = 7–10 per treatment. Means without a common symbol differed, p < 0.05.
 ) diets. Values are means + SEM, n = 7–10 per treatment. Means without a common symbol differed, p < 0.05.
References
-
- Hack M, Horbar JD, Malloy MH, Tyson JE, Wright E, Wright L. Very low birth weight outcomes of the National Institute of Child Health and Human Development Neonatal Network. Pediatrics. 1991;87:587–597. - PubMed
-
- Hack M, Fanaroff AA. Outcomes of extremely-low-birth-weight infants between 1982 and 1988. N Engl J Med. 1989;321:1642–1647. - PubMed
-
- Ehrenkranz RA, Younes N, Lemons JA, Fanaroff AA, Donovan EF, Wright LL, Katsikiotis V, Tyson JE, Oh W, et al. Longitudinal growth of hospitalized very low birth weight infants. Pediatrics. 1999;104:280–289. - PubMed
-
- Ford GW, Doyle LW, Davis NM, Callanan C. Very low birth weight and growth into adolescence. Arch Pediatr Adolesc Med. 2000;154:778–784. - PubMed
-
- Peralta-Carcelen M, Jackson DS, Goran MI, Royal SA, Mayo MS, Nelson KG. Growth of adolescents who were born at extremely low birth weight without major disability. J Pediatr. 2000;136:633–640. - PubMed
Publication types
MeSH terms
Substances
Grants and funding
LinkOut - more resources
Full Text Sources
Other Literature Sources
Research Materials
Miscellaneous

