. 2013 Jul;52(7):555-67.
doi: 10.1002/mc.21891. Epub 2012 Mar 5.

Regulation of pancreatic cancer growth by superoxide

Affiliations

Regulation of pancreatic cancer growth by superoxide

Juan Du et al. Mol Carcinog. 2013 Jul.

Abstract

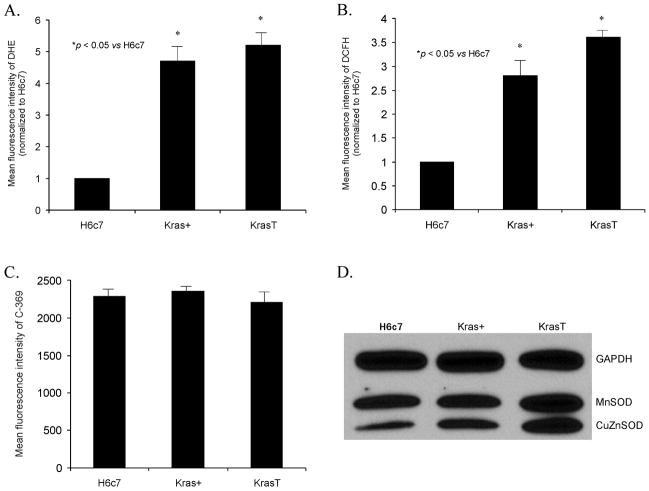
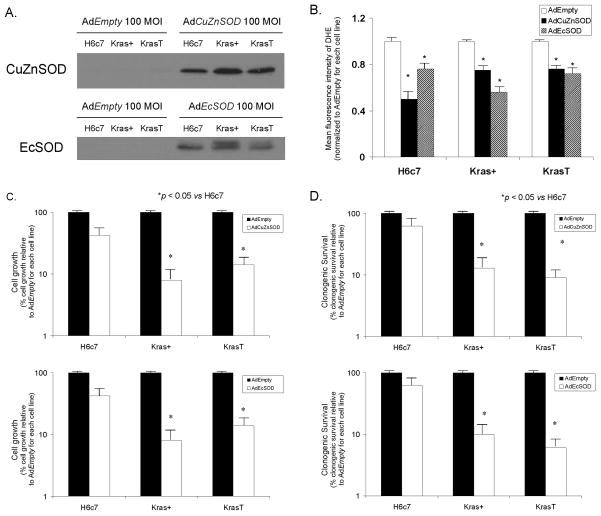
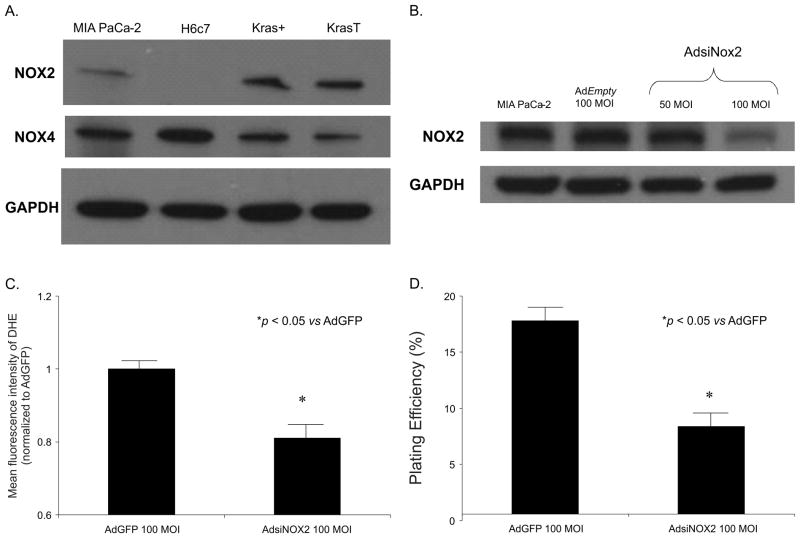
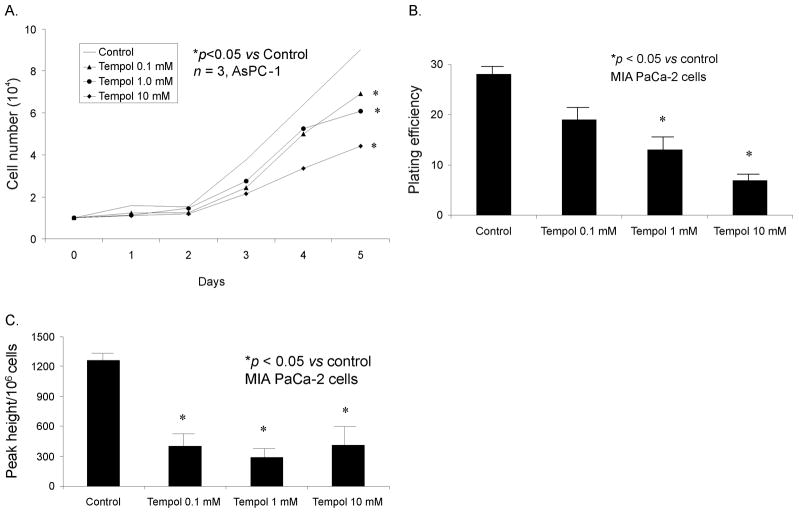
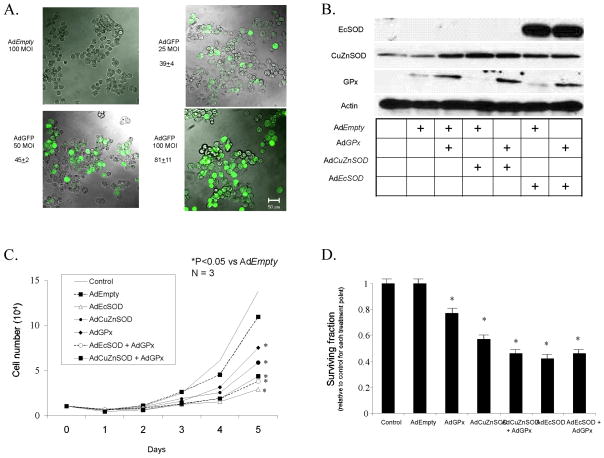
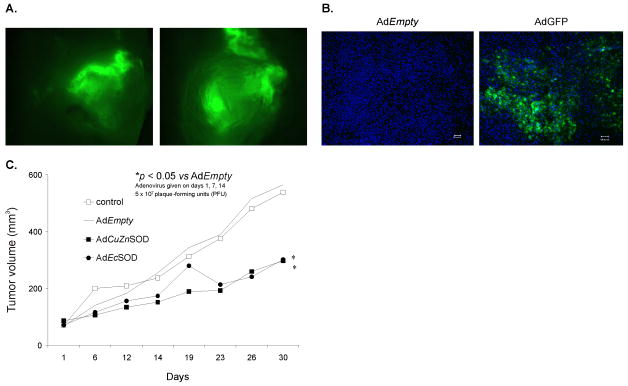
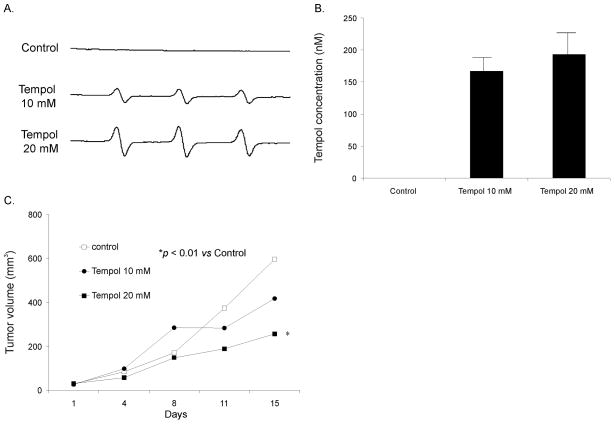
K-ras mutations have been identified in up to 95% of pancreatic cancers, implying their critical role in the molecular pathogenesis. Expression of K-ras oncogene in an immortalized human pancreatic ductal epithelial cell line, originally derived from normal pancreas (H6c7), induced the formation of carcinoma in mice. We hypothesized that K-ras oncogene correlates with increased non-mitochondrial-generated superoxide (O 2.-), which could be involved in regulating cell growth contributing to tumor progression. In the H6c7 cell line and its derivatives, H6c7er-Kras+ (H6c7 cells expressing K-ras oncogene), and H6c7eR-KrasT (tumorigenic H6c7 cells expressing K-ras oncogene), there was an increase in hydroethidine fluorescence in cell lines that express K-ras. Western blots and activity assays for the antioxidant enzymes that detoxify O 2.- were similar in these cell lines suggesting that the increase in hydroethidine fluorescence was not due to decreased antioxidant capacity. To determine a possible non-mitochondrial source of the increased levels of O 2.-, Western analysis demonstrated the absence of NADPH oxidase-2 (NOX2) in H6c7 cells but present in the H6c7 cell lines expressing K-ras and other pancreatic cancer cell lines. Inhibition of NOX2 decreased hydroethidine fluorescence and clonogenic survival. Furthermore, in the cell lines with the K-ras oncogene, overexpression of superoxide dismutases that detoxify non-mitochondrial sources of O 2.-, and treatment with the small molecule O 2.- scavenger Tempol, also decreased hydroethidine fluorescence, inhibited clonogenic survival and inhibited growth of tumor xenografts. Thus, O 2.- produced by NOX2 in pancreatic cancer cells with K-ras, may regulate pancreatic cancer cell growth.


Figures

Figure 1
Figure 1. Expression of K-ras oncogene leads to increased levels of ROS in human pancreatic pancreatic ductal epthelial cells
A. H6c7 cells that express K-ras oncogene (Kras+ and KrasT) demonstrate a 4.5 to 5-fold increase in hydroethidine fluorescence compared to the H6c7 cell line. Cells were incubated and then stained with hydroethidine (DHE). Mean fluorescence intensity was measured via flow cytometry, corrected for background fluorescence levels, and normalized to the H6c7 cell line. *p < 0.05 vs H6c7 cells, means ± SEM, n = 3. B. H6c7 cells that express K-ras oncogene (Kras+ and KrasT) demonstrate a 2.5 to 3.0-fold increase in DCFH fluorescence compared to the parental (H6c7) cell line. Cells were incubated in various treatment groups and then stained with DCFH and analyzed as described in A. *p < 0.05 vs H6c7 cells, means ± SEM, n = 3. C. MFI was similar in H6c7 cells, Kras+ cells and KrasT cells when labeled with the non-oxidation sensitive dye C-369, demonstrating that changes in MFI in panel B are indicative of changes in steady-state levels of dye oxidation. D. Western blots for the antioxidant enzymes CuZnSOD and MnSOD were determined. Expression of K-ras oncogene did not result in decreases in antioxidant protein to account for the increases in DHE or DCFH fluorescence.
Figure 2
Figure 2. Overexpression of CuZnSOD or EcSOD decreases hydroethidine fluorescence, cell growth and clonogenic survival in cell lines expressing K-ras
A. The H6c7 cell line and its derivatives, Kras+, and KrasT, were infected with either AdEmpty, AdCuZnSOD, or AdEcSOD at 100 MOI. AdCuZnSOD 100 MOI increased CuZnSOD protein in all of the cell lines compared to controls and cells infected with AdEmpty vector (100 MOI). AdEcSOD 100 MOI also increased EcSOD protein in all of the cell lines compared to controls and cells infected with the AdEmpty vector (100 MOI). There are two bands noted on the EcSOD Western blot. The top band (32 kDa) is the EcSOD protein with heparin binding domain and the bottom band (29.5 kDa) corresponds to the EcSOD protein without heparin binding domain. B. Intracellular hydroethidine fluorescence decreased in H6c7, Kras+, and KrasT cells infected with AdCuZnSOD, or AdEcSOD. Intracellular superoxide levels as measured by DHE decreased significantly 24–48 hours after infection with AdCuZnSOD, or AdEcSOD 100 MOI compared to the same cells infected with the AdEmpty vector. *p < 0.05 vs AdEmpty, means ± SEM, n = 3. C. Cell growth was decreased after infection with the AdCuZnSOD and AdEcSOD vectors. The H6c7 cell line and its derivatives, Kras+, and KrasT, were transduced with AdEmpty, AdCuZnSOD or AdEcSOD at 100 MOI. AdCuZnSOD and AdEcSOD demonstrated reductions in cell growth in cells expressing the K-ras oncogene. Mean in vitro cell growth on day 6 is shown. Each point represents the mean values, n = 3. * p < 0.05 vs 100 MOI AdEmpty. D. Clonogenic survival. CuZnSOD and EcSOD overexpression decreased clonogenic survival only in the cell lines with expression of K-ras oncogene. Dark bars represent the surviving fraction of cells treated with the AdEmpty vector (100 MOI), while the open bars represent the surviving fraction treated with AdCuZnSOD or AdEcSOD. Each point represents the mean values, with p < 0.05 vs. AdEmpty, n = 3.
Figure 3
Figure 3. NOX2 is involved in superoxide production in pancreatic cancer cells
A. Western blot analysis for NOX2 demonstrates expression in MIA PaCa-2, Kras+ and KrasT cells but no expression in the H6c7 pancreatic ductal epithelial cell line. NOX4 was present in all cell lines tested. GAPDH was used as a loading control B. An adenoviral vector expressing siRNA against NOX2 (AdsiNOX2) was transfected into the MIA PaCa-2 pancreatic cancer cell line. At 100 MOI, there was a significant decrease in immunoreactive protein when compared to both the parental cell line and cells transfected the adenoviral control vector AdGFP (100 MOI). C. MIA PaCa-2 cells infected with the AdsiNOX2 vector demonstrate a significant decrease in hydroethidine fluorescence when compared to the same cell line infected with the AdGFP vector. Mean fluorescence intensity was measured via flow cytometry, corrected for background fluorescence levels, and normalized to the cells infected with AdGFP. *p < 0.05 vs AdGFP cells, means ± SEM, n = 3. D. AdsiNOX2 infection (100 MOI) in MIA PaCa-2 cells decreased plating efficiency when compared to the same cell line infected with the AdGFP vector (100 MOI). Each point represents the mean values, with p < 0.05 vs. AdGFP, n = 3.
Figure 4
Figure 4. Tempol inhibits pancreatic cancer cell growth
A. For cell growth, cells were treated with Tempol (0, 0.1, 1.0, and 10 mM) for 1 h. Mean in vitro cell growth of AsPC-1 cells are shown. B. For clonogenic survival, cells were treated with Tempol (0, 0.1, 1 and 10 mM) for 1 h, 400 cells were plated in each well of 6-well plates and incubated at 37°C for 14 days. Colonies were fixed and stained with Coomassie blue; only colonies with more than 50 cells were counted. Each point was determined in triplicate from the same culture. * p < 0.01 vs control. C. Electron paramagnetic resonance was performed in MIA PaCa-2 cells treated with Tempol to determine superoxide levels. EPR spectra were acquired and peak heights were quantified and compared in cells treated with Tempol (0.1–10 mM). DMPO-OH signals from MIA PaCa-2 cells treated with Tempol. In the spectral analysis the Tempol signals were removed to see the DMPO-OH signal better.
Figure 5
Figure 5. Superoxide is a growth signal in pancreatic cancer
A. Fluorescence Analysis. MIA PaCa-2 cells were seeded in 8-well chamber slides (Thermo Fisher Scientific, Rochester, NY). Cells were infected with 25, 50 and 100 MOI of AdGFP in serum-free DMEM for 24 h, and then incubated with full media for an additional 24 h. AdEmpty (100 MOI) was used as a control. Cells were fixed with 4% para-formaldehyde for 15 min at room temperature and examined with a fluorescence microscope (Olympus BX-51). For each field, GFP expressing cells and non-expressing cells were counted and the ratio of GFP positive cells was calculated. Fluorescence photomicrographs of MIA PaCa-2 cells infected with increasing viral titer of the AdEmpty or AdGFP constructs demonstrate that there is no fluorescence in the group of cells that received the AdEmpty vector. However, increasing doses of the AdGFP construct increases the percentage of cells that stain positive for GFP. B. Western analysis of MIA PaCa-2 cells infected with the AdEmpty, AdGPx, AdCuZnSOD and AdEcSOD or combinations. To equalize the viral load of the combined virus in these experiments, the AdEmpty vector was given. For example, the 50 MOI AdGPx was given along with 50 MOI AdEmpty to equal the viral load of the combination of AdGPx (50 MOI) + AdCuZnSOD or AdEcSOD (50 MOI). Lane assignments: 1 = Control; 2 = AdEmpty; 3 = AdEmpty + AdGPx; 4 = AdEmpty + AdCuZnSOD; 5 = AdGPx + AdCuZnSOD; 6 = AdEmpty + AdEcSOD; 7 = AdGPx + AdEcSOD. C. Cell growth. MIA PaCa-2 cells transduced with 50 MOI AdGPx, 50 MOI AdCuZnSOD (± 50 MOI AdGPx), or 50 MOI AdEcSOD (± 50 MOI AdGPx), demonstrated significant reductions in growth compared to the parental cells and those infected with AdEmpty. No significant changes were seen with AdEmpty transfer compared with parental cells. Mean in vitro cell growth of MIA PaCa-2 cells are shown. Each point represents the mean values, n = 3. * p < 0.001 vs AdEmtpy. D. Clonogenic survival. MIA PaCa-2 cells transduced with 50 MOI AdCuZnSOD, AdEcSOD, AdGPx, AdCuZnSOD + AdGPx, or AdEcSOD +AdGPx demonstrated reductions in clonogenic survival compared to AdEmpty transduced cells. As in the cell growth experiments, the AdEmpty vector was given to equalize the viral load of the combined virus. Values are mean plating efficiency ± SEM of MIA PaCa-2, n = 3. *p < 0.05 vs AdEmpty.
Figure 6
Figure 6. Intratumoral injections of AdCuZnSOD and AdEcSOD inhibit growth
A. Detection of transgene expression and biodistribution in whole tumor xenografts. MIA PaCa-2 cells (2 × 10⁶) were injected subcutaneously into the flank region of nude mice and allowed the tumors to reach 4–5 mm in diameter. Tumors were then injected with AdGFP or AdEmpty adenoviral vectors. Two representative tumors demonstrate GFP expression which is clearly visible by the green fluorescence and heterogeneously distributed throughout the tumor. B. Histological sections detecting transgene expression and biodistribution in MIA PaCa-2 human pancreatic tumor xenograft in vivo after intratumoral injection of an AdGFP construct (1 × 10⁹ PFU). AdEmpty was used as the control. Low power fields of fluorescence microscopy on sections from tumors injected with AdEmpty and AdGFP respectively. Sections were counterstained with DAPI. GFP expressing cells are clearly visible by their green fluorescence and are widely distributed throughout the tumor. Bar = 100 microns. C. AdCuZnSOD or AdEcSOD injections decreased MIA PaCa-2 tumor growth in nude mice. The AdCuZnSOD and AdEcSOD groups had significantly slower tumor growth when compared to the AdEmpty group (p < 0.05, n = 6–8/group). MIA PaCa-2 tumor cells (2 × 10⁶) were delivered subcutaneously into the flank region of nude mice. Controls received serum-free media in similar volumes. 5 × 10⁷ PFUs of the AdCuZnSOD, AdEcSOD, or AdEmpty constructs were delivered to the tumor on days 1, 7 and 14 of the experiment. On day 30 there was nearly a 2-fold decrease in tumor growth in animals receiving the AdEcSOD vector or AdCuZnSOD when compared to treatment with the AdEmpty vector.
Figure 7
Figure 7. Tempol inhibits the growth of pancreatic tumor xenografts
A. Representative EPR spectra obtained from plasma in mice after they were sacrificed demonstrating the Tempol signal in mice that received Tempol (10 or 20 mM) in their drinking water. Mice that did not receive Tempol in the drinking water had no EPR signal. B. EPR spectra were acquired and peak heights were quantified and compared against Tempol standard solutions in PBS to determine absolute levels of Tempol. EPR demonstrated significant peaks for Tempol in the plasma of mice receiving Tempol 10 mM or 20 mM in the drinking water. As expected, there were no detectable signals for Tempol in mice with no Tempol in the drinking water. C. Statistical analysis focused on the effects of different treatments tumor progression. The primary outcome of interest was tumor growth over time. Mice were injected with tumor cells at the start of each study. They were then randomly assigned to a treatment group and followed until death or until the experiment was terminated. Tumor sizes (mm3) were periodically measured throughout the experiments, resulting in repeated measurements for each mouse. Linear mixed effects regression models were used to estimate and compare group-specific tumor growth curves. Pairwise comparisons were performed to identify specific group differences in the growth curves. All tests were two-sided and carried out at the 5% level of significance. Pairwise group comparisons were carried out to assess group differences. Significant differences were observed for Control vs. Tempol 20 mM (p < 0.01), and Tempol 10 mM vs. Tempol 20 mM (p < 0.01).

References

    1. MacMillan-Crow LA, Greendorfer JS, Vickers SM, Thompson JA. Tyrosine nitration of c-SRC tyrosine kinase in human pancreatic ductal adenocarcinoma. Arch Biochem Biophys. 2000;377:350–6. - PubMed
    1. Vaquero EC, Edderkaoui M, Pandol SJ, Gukovsky I, Gukovskaya AS. Reactive oxygen species produced by NAD(P)H oxidase inhibit apoptosis in pancreatic cancer cells. J Biol Chem. 2004;279:34643–54. - PubMed
    1. Irani K, Xia Y, Zweier JL, Sollott SJ, Der CJ, Fearon ER, et al. Mitogenic signaling mediated by oxidants in Ras-transformed fibroblasts. Science. 1997;275:1649–51. - PubMed
    1. Santillo M, Mondola P, Seru R, Annella T, Cassano S, Ciullo I, et al. Opposing functions of Ki- and Ha-Ras genes in the regulation of redox signals. Curr Biol. 2001;11:614–9. - PubMed
    1. Yang JQ, Li SJ, Domann FE, Buettner GR, Oberley LW. Superoxide generated in v-Ha-ras-transduced human keratinocyte HaCaT cells. Mol Carcinog. 1999;26:180–8. - PubMed

Publication types

MeSH terms