. 2012 Mar 20;109(12):4449-54.
doi: 10.1073/pnas.1201333109. Epub 2012 Mar 5.

Focused ion beam micromachining of eukaryotic cells for cryoelectron tomography

Affiliations

Focused ion beam micromachining of eukaryotic cells for cryoelectron tomography

Alexander Rigort et al. Proc Natl Acad Sci U S A. .

Abstract

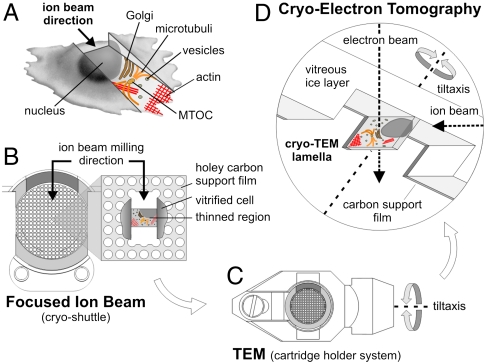
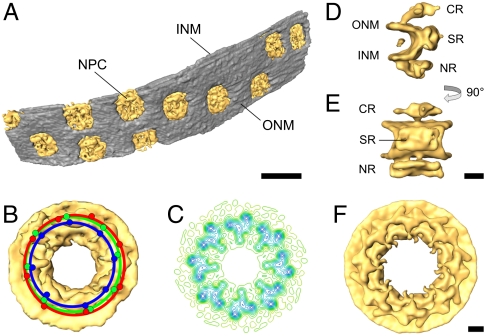
Cryoelectron tomography provides unprecedented insights into the macromolecular and supramolecular organization of cells in a close-to-living state. However because of the limited thickness range (< 0.5-1 μm) that is accessible with today's intermediate voltage electron microscopes only small prokaryotic cells or peripheral regions of eukaryotic cells can be examined directly. Key to overcoming this limitation is the ability to prepare sufficiently thin samples. Cryosectioning can be used to prepare thin enough sections but suffers from severe artefacts, such as substantial compression. Here we describe a procedure, based upon focused ion beam (FIB) milling for the preparation of thin (200-500 nm) lamellae from vitrified cells grown on electron microscopy (EM) grids. The self-supporting lamellae are apparently free of distortions or other artefacts and open up large windows into the cell's interior allowing tomographic studies to be performed on any chosen part of the cell. We illustrate the quality of sample preservation with a structure of the nuclear pore complex obtained from a single tomogram.


Conflict of interest statement

The authors declare no conflict of interest.

Figures

Fig. 1.
Fig. 1.
Schematic of the in situ TEM lamella preparation method. (A) Cartoon illustrating the result of thinning an adherent eukaryotic cell by means of milling with a focused ion beam microscope. The resulting thinned region represents a cutout view of the cytoplasm and is used for subsequent imaging by cryoelectron tomography. MTOC: microtubule-organizing center. (B) TEM lamella preparation on an EM grid in the FIB instrument. The EM grid is mounted into a ring-like autogrid framing (light gray), which is modified on one side by a cutout (dark gray) to permit milling from grazing angles (see Fig. S1B). The autogrid remains clamped in a cryoholder [cryoshuttle, (12)], which can be shuttered during transfers. A central mesh on the EM grid is selected and milling is performed under grazing angles by applying two milling patterns: One is located above the intended lamella region the second one below that region (compare Fig. 2A). (C) The autogrid, containing the in situ lamella, is transferred into a TEM holder system with respect to the required tilt axis geometry. (D) Schematic perspective cross-section drawing showing imaging of the lamella in the TEM instrument. The in situ lamella is prepared by removing vitreously frozen ice and cellular material as well as the carbon support film with two milling patterns (upper and lower pattern). The resulting lamella region allows tomographic imaging over the full tilt range of the TEM goniometer. Diameter of the autogrid shown: 3.5 mm.
Fig. 2.
Fig. 2.
FIB lamella milling of frozen-hydrated D. discoideum. (A) FIB micrograph of a frozen-hydrated cell embedded in a thin layer of ice and attached to the holey carbon support film (view in the direction of the incident ion beam). In order to prepare an in situ lamella, an upper and lower pattern for site-specific milling is defined (white dotted rectangles). (B) Corresponding region after FIB milling yielding the lamella (white arrowheads) which is supported on the sides by the remaining bulk ice material. (C) SEM top view of the same region showing the prepared area, having a size of approximately 25 μm2. (D) TEM micrograph of the boxed region from (C) taken after cryotransfer of the lamella into the TEM. The high pass filtered image of the thinned region exhibits a view into the cell’s cytoplasm. On the right side of the micrograph the milling edge can be recognized, containing putative gallium droplets (white asterisks) responsible for curtaining streaks (white arrowheads; showing direction of milling). (E) Slice from tomographic reconstruction of the boxed region in (D). Traversing microtubules (white arrowheads) and various interconnecting ducts and cisternae structures can be recognized. [Scale bars, (AC) 5 μm, (D) 1 μm, (E) 200 nm.]
Fig. 3.
Fig. 3.
Preparation of an in situ TEM lamella across a large portion of the cell’s cytoplasm. (A) TEM micrographs stitched together to obtain an overview image of the lamella. On the left side the border region between ice and cell membrane can be recognized (black arrowhead). Within the lamella, the nuclear envelope (white arrowhead) can be clearly discerned, separating the nucleoplasm from the cytoplasm. The white arrow indicates the milling direction and highlights a prominent curtaining streak across the lamella. (B) Corresponding lamella imaged at lower magnification after recording of a tomographic tilt series. The dashed square regions denote the areas for tomographic exposure and focus, which are arranged along the tilt axis (for the corresponding tomographic reconstruction see Fig. 4). Some frost particles can be discerned across the lamella and on its sides (white asterisks in A and B). The framed region in (A) corresponds to the tomographic exposure region shown in (B). [Scale bars, (A) 1 μm, (B) 2 μm].
Fig. 4.
Fig. 4.
Cryoelectron tomograms of D. discoideum cells. (A) Slice through the x,y-plane of a tomographic reconstruction (area corresponds to the exposure region described in Fig. 3) showing the nuclear envelope (black arrowhead) with nuclear pore complexes (white arrowheads) separating cytoplasm from nucleoplasm. In the cytoplasm, parts of the rough endoplasmic reticulum (white stars), tubular mitochondria (asterisks) and microtubules (white arrows) can be recognized. (B and C) Displays the corresponding x,z and y,z-planes (sectional planes are indicated by the red dashed lines). The thickness of the lamella is approximately 300 nm. (D) Surface rendered visualization of the tomographic volume from (A), displaying nuclear envelope, endoplasmic reticulum, mitochondria, microtubules, vacuolar compartment, and putative ribosomes. (E) Tomographic slice along the x,y-plane showing a cytoplasmic volume traversed by several microtubules (white arrowheads). (F and G) Corresponding x,z and y,z-planes. The overall volume has a thickness of approximately 200 nm. (H) Surface rendered visualization of the tomographic volume from (E), showing microtubules (orange) traversing the volume in various directions. A dense network of interconnecting tubular structures and vesicles can be seen. [Scale bars, (A and E) 200 nm.]
Fig. 5.
Fig. 5.
Structure of the nuclear pore complex from D. discoideum obtained by subtomogram averaging of the NPCs from the tomogram depicted in Fig. 4. (A) Surface representation of the segmented nuclear envelope (NPCs: yellow; nuclear envelope: gray). (B) Structure of the NPC obtained by averaging the three full pores in the tomogram, without imposing rotational symmetry. The red, green, and blue dots represent the positions of the protomers for each of the pores. Note that while all pores are round, there is a variation in their diameter (10%) and from the ideal 45 degrees dictated by eightfold symmetry. (C) Contour-line representation of a slice of the cytoplasmic ring of the NPC. (D and E) Views of a protomer of the NPC obtained from averaging all protomers in the pores depicted in (A) (D: side view; E: view from the central channel). (F) Structure of the NPC reconstructed by applying eightfold symmetry to the protomer depicted in (D and E). For clarity, the material in the central channel (approximately 50 nm) is omitted in (B to F). (B, C, F) view from the cytoplasm. NPC: nuclear pore complex; ONM: outer nuclear membrane; INM: inner nuclear membrane; CR: cytoplasmic ring; SR: spoke ring; NR: nuclear ring. [Scale bars: (A) 200 nm, (BF) 25 nm.]

Comment in

  • Etch-a-cell.
    Doerr A. Doerr A. Nat Methods. 2012 May;9(5):434. doi: 10.1038/nmeth.2006. Nat Methods. 2012. PMID: 22803201 No abstract available.

References

    1. Koster AJ, et al. Perspectives of molecular and cellular electron tomography. J Struct Biol. 1997;120:276–308. - PubMed
    1. Lucic V, Forster F, Baumeister W. Structural studies by electron tomography: from cells to molecules. Annu Rev Biochem. 2005;74:833–865. - PubMed
    1. Baumeister W. From proteomic inventory to architecture. FEBS Lett. 2005;579:933–937. - PubMed
    1. Grunewald K, et al. Three-dimensional structure of herpes simplex virus from cryo-electron tomography. Science. 2003;302:1396–1398. - PubMed
    1. Medalia O, et al. Macromolecular architecture in eukaryotic cells visualized by cryoelectron tomography. Science. 2002;298:1209–1213. - PubMed

Publication types