. 2012 Apr 1;188(7):3513-21.
doi: 10.4049/jimmunol.1102693. Epub 2012 Mar 5.

Inhibition of epidermal growth factor receptor tyrosine kinase ameliorates collagen-induced arthritis

Affiliations

Inhibition of epidermal growth factor receptor tyrosine kinase ameliorates collagen-induced arthritis

Christina D Swanson et al. J Immunol. .

Abstract

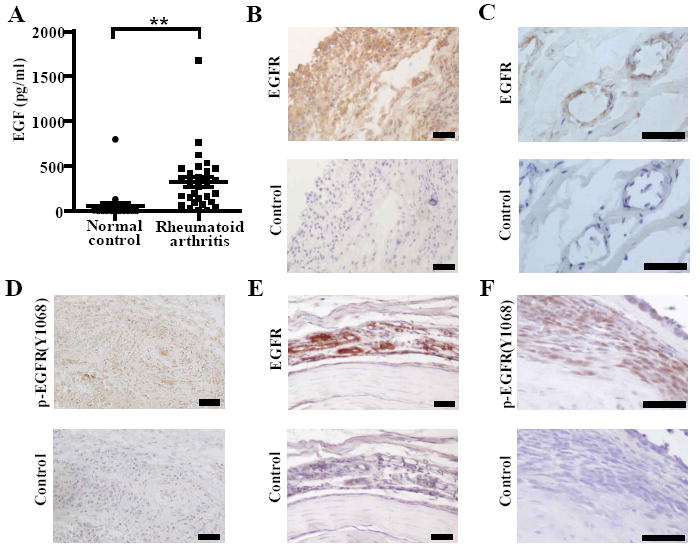
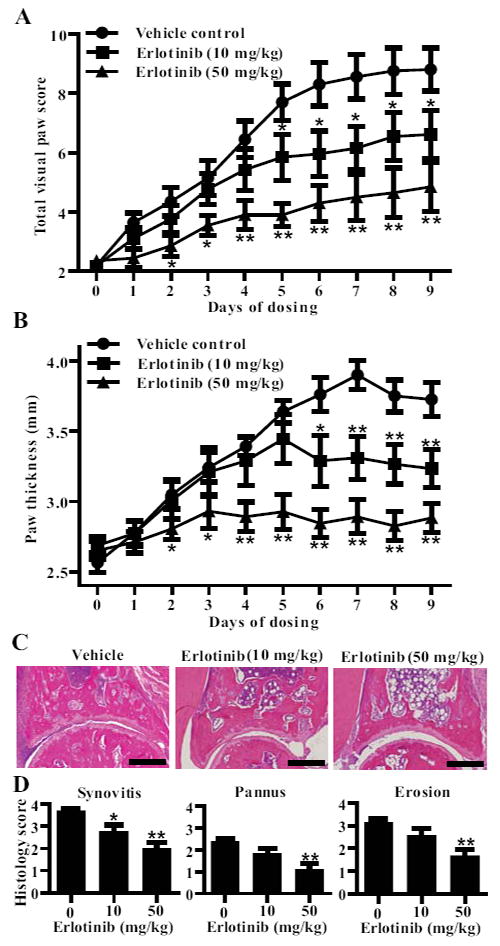
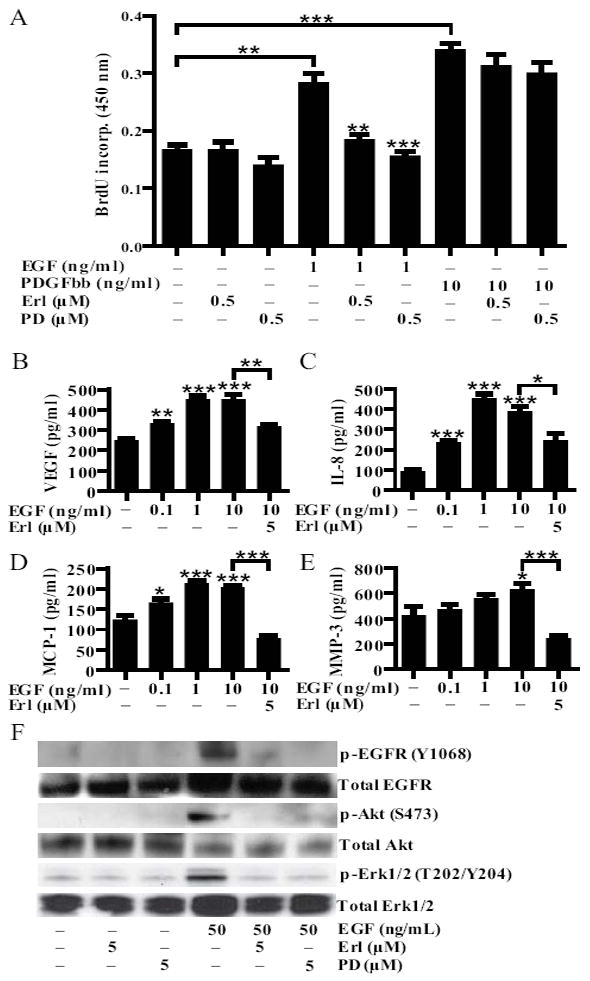
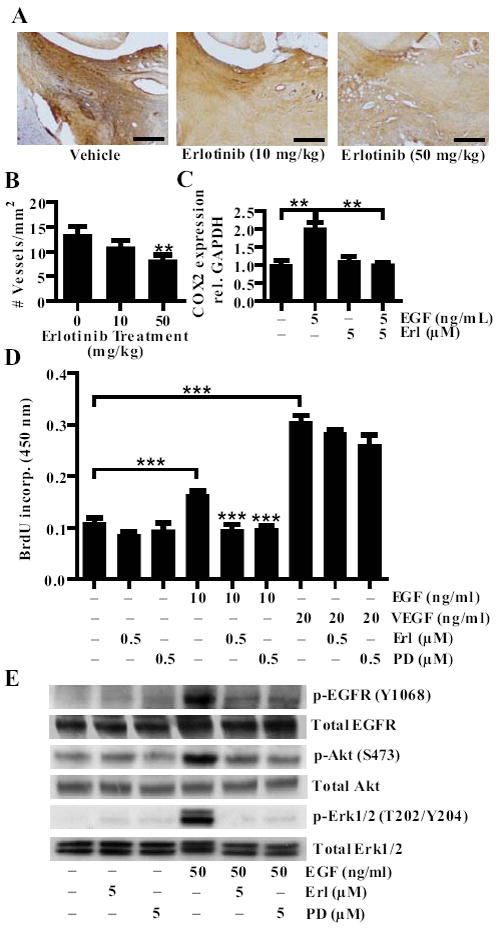
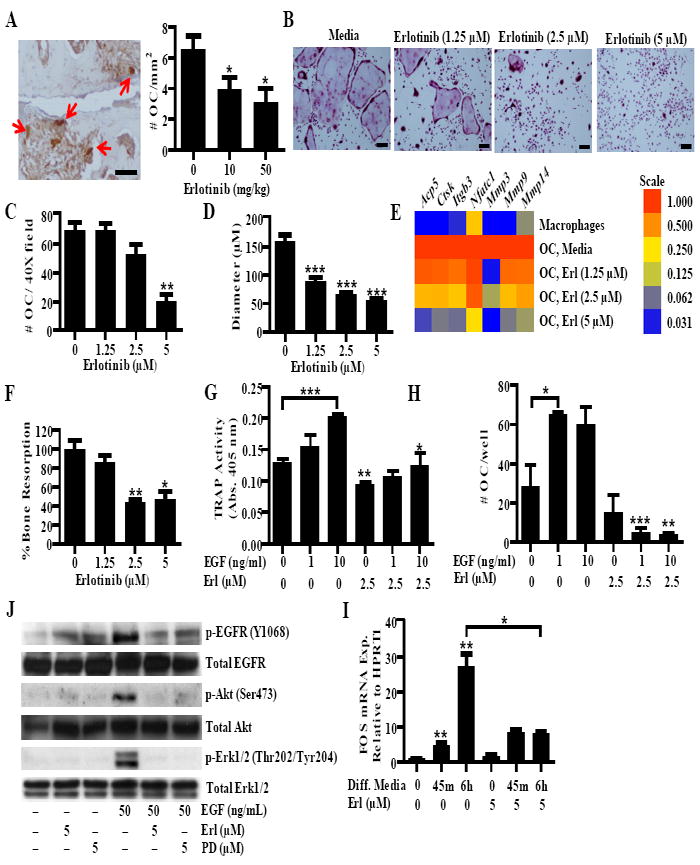
Rheumatoid arthritis (RA) is an autoimmune synovitis characterized by the formation of pannus and the destruction of cartilage and bone in the synovial joints. Although immune cells, which infiltrate the pannus and promote inflammation, play a prominent role in the pathogenesis of RA, other cell types also contribute. Proliferation of synovial fibroblasts, for example, underlies the formation of the pannus, while proliferation of endothelial cells results in neovascularization, which supports the growth of the pannus by supplying it with nutrients and oxygen. The synovial fibroblasts also promote inflammation in the synovium by producing cytokines and chemokines. Finally, osteoclasts cause the destruction of bone. In this study, we show that erlotinib, an inhibitor of the tyrosine kinase epidermal growth factor receptor (EGFR), reduces the severity of established collagen-induced arthritis, a mouse model of RA, and that it does so by targeting synovial fibroblasts, endothelial cells, and osteoclasts. Erlotinib-induced attenuation of autoimmune arthritis was associated with a reduction in number of osteoclasts and blood vessels, and erlotinib inhibited the formation of murine osteoclasts and the proliferation of human endothelial cells in vitro. Erlotinib also inhibited the proliferation and cytokine production of human synovial fibroblasts in vitro. Moreover, EGFR was highly expressed and activated in the synovium of mice with collagen-induced arthritis and patients with RA. Taken together, these findings suggest that EGFR plays a central role in the pathogenesis of RA and that EGFR inhibition may provide benefits in the treatment of RA.


Figures

FIGURE 1
FIGURE 1
EGF and EGFR are expressed in RA and CIA. A, EGF concentration was measured in serum from normal controls (n = 20) and RA patients (n = 30) by ELISA (**P <0.01). RA synovial tissue was sectioned and examined for EGFR staining (B) in the synovial lining and (C) in the subsynovial tissue. RA synovial tissue was examined for (D) phosphorylated (p)-EGFR (Y1068) expression. E, Paws from mice with CIA (score 4) were stained for EGFR and (F) p-EGFR (Y1068). Pictures represent areas of pannus surrounding the bone next to inflammatory foci. B-F, Control sections indicate adjacent sections stained with appropriate isotype control antibodies. A-C, Data represent two experiments. E and F, Data represent at least four experiments. Bars represent 50 μm.
FIGURE 2
FIGURE 2
Erlotinib treatment ameliorates CIA. Following the development of arthritis, DBA1/J mice with CIA were randomly enrolled in a treatment group when they reached a mean arthritic score between 2 and 4. Mice were administered vehicle (n = 10), 10 mg/kg (n = 12), 50 mg/kg (n = 12) erlotinib suspended in vehicle twice daily by oral gavage. A, Arthritis severity was assessed using a visual arthritis scoring system and (B) caliper measurements of paw thickness (*P < 0.05; **P < 0.01). Data represent one experiment of at least three independent experiments. To analyze disease pathology, (C) representative pictures of paw sections were taken, and (D) blinded histological scores of synovitis, pannus formation and bone and cartilage erosion were made (*P < 0.05; **P < 0.01). Bars represent 300 μm. Groups were compared at each time point using a Mann Whitney analysis comparing erlotinib treated mice to vehicle-treated mice. Error bars indicate ± SEM.
FIGURE 3
FIGURE 3
Erlotinib reduces RA synovial fibroblasts proliferation and cytokine production. A, RA synovial fibroblasts were stimulated with EGF (1 ng/ml) and PDGFbb (10 ng/ml) and concurrently treated with erlotinib (0.5 μM) or PD153035 (0.5 μM). After 48 hours of incubation, proliferation was analyzed by BrdU incorporation. B-E, RA synovial fibroblasts were stimulated with increasing concentrations of EGF and concurrently treated with erlotinib (5 μM). After 48 hours of incubation, the concentrations of (B) VEGF, (C) IL-8, (D) MCP-1 and (E) MMP-3 were determined by ELISA. Data represent one experiment of at least three independent experiments (*P < 0.05; **P < 0.01; *** P < 0.001). Error bars indicate ± SEM. E, To examine EGFR signaling in the cells, cells were pretreated with erlotinib (5 μM) or PD153035 (5 μM) for 30 minutes, stimulated with EGF (50 ng/ml) for 5 minutes, and cell lysates were examined via western blotting. Data represent one experiment of at least three independent experiments. PD = PD153035.
FIGURE 4
FIGURE 4
Erlotinib inhibits HUVEC proliferation and COX-2 expression. A, Mice with CIA were treated with vehicle, 10 or 50 mg/kg of erlotinib twice daily by oral gavage. Paws were collected, sectioned and stained for von willebrand factor (VWF). Bars represent 150 μm. B, The number of VWF positive vessels in the ankle was quantified per square area for each treatment group (**P < 0.01). C, HUVEC were stimulated with 5 ng/ml of EGF for 45 minutes with or without concurrent treatment with 5 μM of erlotinib. Cells were collected in Trizol and RTPCR was performed to determine COX-2 mRNA expression. D, HUVEC were stimulated with EGF (10 ng/ml) or VEGF (20 ng/ml) and treated with either erlotinib (0.5 μM) or PD153035 (0.5 μM). Proliferation was measured by BrdU incorporation. E, To examine signaling in the cells, cells were pretreated with erlotinib (5 μM) or PD153035 (5 μM) for 30 minutes, stimulated with EGF (50 ng/ml) for 5 minutes, and cell lysates were examined via western blotting. C-D, Data represent one experiment of at least three independent experiments (**P < 0.01; *** P < 0.001). Error bars indicate ± SEM.
FIGURE 5
FIGURE 5
Erlotinib inhibits osteoclastogenesis. A, Paw sections from CIA mice treated with vehicle or erlotinib were stained for TRAP. Arrows indicate osteoclasts defined as large, TRAP+ cells adjacent to bone. The number of osteoclasts was quantified for each treatment group. B-E, Osteoclasts were treated with erlotinib during the differentiation period and stained for TRAP. B, Representative pictures were taken, and the (C) number of osteoclasts and (D) relative diameter was determined using Image J analysis. For quantification, osteoclasts were defined as TRAP+ cells with three or more nuclei. E, Expression of osteoclast specific genes and mmps was quantified in macropahges and osteoclasts treated with erlotinib. Gene expression was normalized to Hprt1 and the level was arbitrarily set to 1 in untreated osteoclasts. F, Osteoclasts were grown on dentin discs and bone resorption was analyzed by toluidine blue staining and image analysis. Data is normalized to the level of untreated osteoclasts. G and H, Osteoclasts were differentiated in the presence of EGF. At day seven, TRAP activity was measured by an (G) enzymatic reaction and the (H) number of osteoclasts per well was counted. I, Osteoclasts were pretreated with either erlotinib (5 μM) or PD153035 (5 μM) and stimulated with EGF (50 ng/ml) for 5 minutes and western blots were performed. J, Monocytes were treated with serum free differentiation media containing M-CSF and RANKL for 45 minutes (min) and six hours (h). Fos expression was determined by QPCR. B-D, G-J, Data represent one experiment of at least three independent experiments E-F, Data represent one experiment of at least two independent experiments. For all experiments (*P < 0.05; ** P < 0.01; *** P < 0.001). A and B, bars represents 150 μm. OC, osteoclast. Error bars indicate ± SEM.

Comment in

References

    1. Cope AP. T cells in rheumatoid arthritis. Arthritis Res Ther. 2008;10(Suppl 1):S1. - PMC - PubMed
    1. Scott DL, Wolfe F, Huizinga TW. Rheumatoid arthritis. Lancet. 2010;376:1094–1108. - PubMed
    1. Firestein GS. Starving the synovium: angiogenesis and inflammation in rheumatoid arthritis. J Clin Invest. 1999;103:3–4. - PMC - PubMed
    1. Schett G. Cells of the synovium in rheumatoid arthritis. Osteoclasts. Arthritis Res Ther. 2007;9:203. - PMC - PubMed
    1. Sullivan T, Benjamin CG, Kempf PW, Deeken JF. Cetuximab in the treatment of rheumatoid arthritis. J Clin Rheumatol. 2010;16:32–33. - PubMed

Publication types

MeSH terms