. 2012;7(2):e32270.
doi: 10.1371/journal.pone.0032270. Epub 2012 Feb 29.

NLRP3 inflammasome: key mediator of neuroinflammation in murine Japanese encephalitis

Affiliations

NLRP3 inflammasome: key mediator of neuroinflammation in murine Japanese encephalitis

Deepak Kumar Kaushik et al. PLoS One. 2012.

Abstract

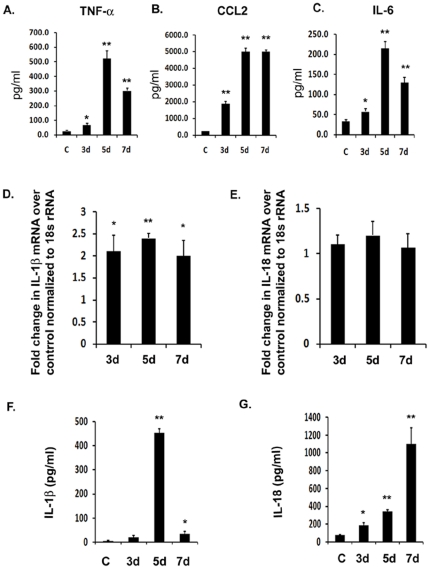
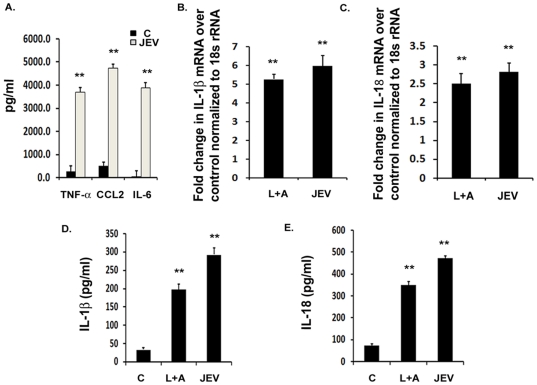
Background: Japanese Encephalitis virus (JEV) is a common cause of acute and epidemic viral encephalitis. JEV infection is associated with microglial activation resulting in the production of pro-inflammatory cytokines including Interleukin-1 β (IL-1β) and Interleukin-18 (IL-18). The Pattern Recognition Receptors (PRRs) and the underlying mechanism by which microglia identify the viral particle leading to the production of these cytokines is unknown.

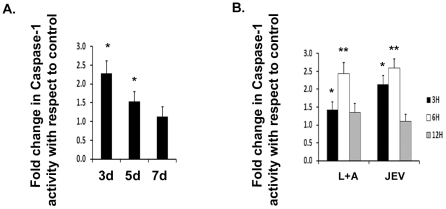
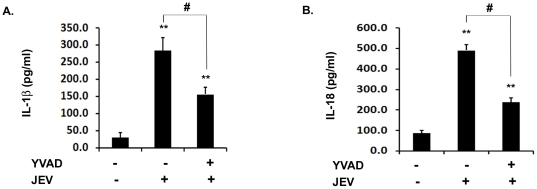
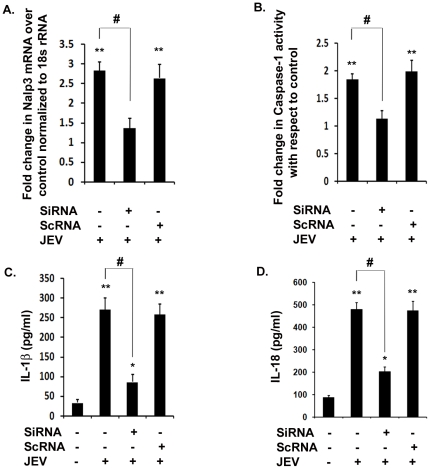
Methodology/principal findings: For our studies, we have used murine model of JEV infection as well as BV-2 mouse microglia cell line. In this study, we have identified a signalling pathway which leads to the activation of caspase-1 as the key enzyme responsible for the maturation of both IL-1β and IL-18 in NACHT, LRR and PYD domains-containing protein-3 (NLRP3) dependent manner. Depletion of NLRP3 results in the reduction of caspase-1 activity and subsequent production of these cytokines.

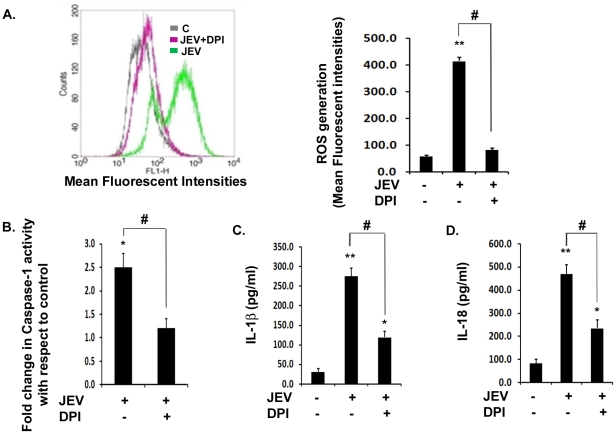
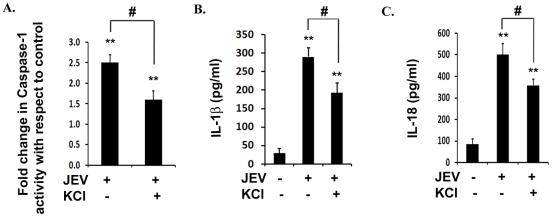
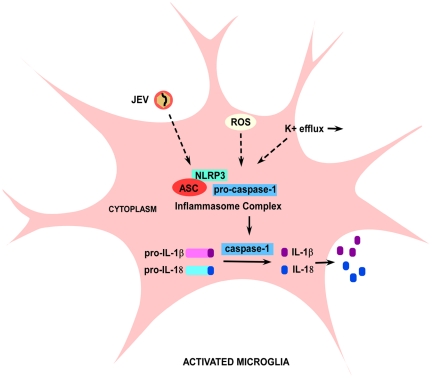
Conclusion/significance: Our results identify a mechanism mediated by Reactive Oxygen Species (ROS) production and potassium efflux as the two danger signals that link JEV infection to caspase-1 activation resulting in subsequent IL-1β and IL-18 maturation.


Conflict of interest statement

Competing Interests: The authors have declared that no competing interests exist.

Figures

Figure 1
Figure 1. JEV induces the production of IL-1β and IL-18 in vivo.
Infection was carried out in BALB/c mice with 5×10⁵ PFU of JEV Intravenously. Brain samples were isolated from mock-infected control (C) as well JEV infected mice after 3 d, 5 d and 7 d post infection. (A–C) Cytokine levels were estimated using CBA. The graphs represent the levels of pro-inflammatory cytokines, TNF-α, CCL2 and IL-6 in pg/ml from protein homogenates isolated from infected and mock-infected mice brain (D–E) qRT-PCR analysis was carried out from total RNA isolated from mock-infected and JEV infected mice brains on all the time points and levels of IL-1β as well as IL-18 mRNA were measured. Graphs represent fold change in mRNA values with respect to mock-infected control normalized to 18 s rRNA internal control. (F–G) ELISA study was carried out to measure the levels of mature IL-1β and IL-18 cytokine from JEV infected as well as uninfected brain samples. Graphs represent the cytokine levels in pg/ml in mock-infected control as well as infected brain samples. Data represent mean ± SEM of 5 animals in each group. Statistical differences were evaluated using one way ANOVA with Bonferroni's post hoc test. *, **, Statistical differences in comparison to mock-infected control values (* p<0.05; ** p<0.01).
Figure 2
Figure 2. JEV induces the production of IL-1β and IL-18 in vitro.
BV-2 microglial cells were infected with 5 MOI of JEV for different time points. LPS+ATP condition was used as a positive control for qRT-PCR, ELISA and caspase-1 activity studies. (A) Cytokine analysis from mock-infected control and JEV infected BV-2 cells was carried out after 6 h of JEV infection using cytokine bead array. Graphs represent the levels of pro-inflammatory cytokines, TNF- α, CCL2 and IL-6 after JEV infection with respect to mock-infected control condition. (B–C) qRT-PCR studies on total RNA isolated from uninfected cells as well as on BV-2 cells infected with JEV for 3 h. IL-1β and IL-18 mRNA levels are represented in terms of fold change with respect to mock-infected control normalized to 18 s rRNA internal control. (D–E) Levels of mature IL-1β and IL-18 cytokines upon JEV infection with respect to mock-infected control condition were measured by ELISA. Graphs represent the fold change values in JEV infected cells with respect to mock-infected control condition. Data represent mean ± SEM from 3 independent experiments performed in duplicate. Statistical differences were evaluated using one way ANOVA with Bonferroni's post hoc test. *, **, Statistical differences in comparison to mock-infected control values (* p<0.05; ** p<0.01).
Figure 3
Figure 3. JEV induces caspase-1 activation in vivo and in vitro.
Infection was carried out in BALB/c mice with 5×10⁵ PFU of JEV Intravenously. Brain samples were isolated from mock-infected control (C) as well JEV infected mice after 3 d, 5 d and 7 d post infection for estimation of caspase-1 activity. (A) Caspase-1 activity is represented as fold change in caspase-1 activity in JEV infected brain with respect to mock-infected brain. Data represent mean ± SEM of 5 animals in each group. (B) Caspase-1 activity was measured in BV-2 cells infected with 5 MOI of JEV after 3 h, 6 h and 12 h of JEV infection over that of mock-infected condition. Caspase-1 activity is represented as fold change with respect to mock-infected condition. Data represent mean ± SEM from 3 independent experiments performed in duplicate. Statistical differences were evaluated using one way ANOVA with Bonferroni's post hoc test. *, **, Statistical differences in comparison to mock-infected control values (* p<0.05; ** p<0.01).
Figure 4
Figure 4. Caspase-1 activity is required for the production of IL-1β and IL-18 during JEV infection.
BV-2 cells were incubated with 5 µM YVAD for 30 min to inhibit caspase-1 activity followed by JEV infection. (A–B) ELISA for IL-1β and IL-18 was carried out in JEV infected BV-2 cells upon caspase-1 inhibition. The cytokine levels were then measured using ELISA and the values are represented in pg/ml. Data represent mean ± SEM from 3 independent experiments performed in duplicate. Statistical differences were evaluated using one way ANOVA with Bonferroni's post hoc test. **, Statistical difference in comparison to mock-infected control values (** p<0.01) and #, Statistical difference with respect to JEV infected condition (p<0.01).
Figure 5
Figure 5. NLRP3 is critical for caspase-1 activity as well as IL-1β and IL-18 production.
Transient knockdown of NLRP3 using 100 nM of NLRP3 SiRNA was carried out in BV-2 microglial cells. Scrambed RNA (ScRNA) was used as a transfection control. This was followed by virus infection with 5 MOI dose for 6 h. (A) NLRP3 mRNA levels were measured by qRT-PCR from total RNA isolated from JEV infected as well as uninfected BV-2 cells. The graph represent a fold change in NLRP3 mRNA with respect to mock-infected control normalised to 18 s rRNA internal control. (B) Caspase-1 activity was also measured in NLRP3 knockdown condition upon JEV infection. Graph represents fold change in caspase-1 activity in different conditions with respect to mock-infected control. (C–D) In order to measure IL-1β and IL-18 production, ELISA was then carried out in NLRP3 knockdown (SiRNA+JEV) condition with respect to JEV infected sample. Graph represents cytokine levels in pg/ml. Data represent mean ± SEM from 3 independent experiments performed in duplicate. Statistical differences were evaluated using one way ANOVA with Bonferroni's post hoc test. *, **, Statistical difference in comparison to mock-infected control values (* p<0.05, ** p<0.01) and #, Statistical difference with respect to JEV infected condition (p<0.01).
Figure 6
Figure 6. Generation of ROS is critical for caspase-1 activity and subsequent IL-1β and IL-18 maturation.
BV-2 cells were incubated with 1 µM of DPI for inhibition of ROS generation. (A) Representative FACS plot showing intracellular ROS production, after 4 h of JEV infection and representation of the Mean Fluorescent Intensities (M.F.I) (right graph) in mock-infected control (C), JEV+DPI and JEV alone condition. (B) Caspase-1 activity measured after 6 h of JEV infection in presence or absence of DPI. Graph represents fold change in caspase-1 activity with respect to mock-infected control. (C–D) ELISA study showing the levels of mature IL-1β and IL-18 in JEV+DPI condition with respect to JEV alone infected sample. Graph represents cytokine levels in pg/ml. For Potassium efflux study, BV-2 cells were incubated with 50 mM KCl for 20 min in order to study the requirement of K+ efflux for caspase-1 activity and its downstream effects. Data represent mean ± SEM from 3 independent experiments performed in duplicate. Statistical differences were evaluated using one way ANOVA with Bonferroni's post hoc test. *, **, Statistical difference in comparison to mock-infected control values (*p<0.05, ** p<0.01) and #, Statistical difference with respect to JEV infected condition (p<0.01).
Figure 7
Figure 7. Potassium efflux is required for caspase-1 activity and subsequent inflammation upon JEV infection.
(A) Caspase-1 activity was measured in presence of KCl upon JEV infection. Graph represents caspase-1 activity in JEV infected cells incubated with KCl with respect to untreated JEV alone condition. (B–C) ELISA study showing the levels of IL-1β and IL-18 in KCl treated condition upon JEV infection over that of JEV alone condition. Graph represents IL-1β and IL-18 levels in pg/ml. Data represent mean ± SEM from 3 independent experiments performed in duplicate. Statistical differences were evaluated using one way ANOVA with Bonferroni's post hoc test. *, **, Statistical difference in comparison to mock-infected control values (*p<0.05, ** p<0.01) and #, Statistical difference with respect to JEV infected condition (p<0.01).
Figure 8
Figure 8. Schematic showing the signalling pathway leading to IL-1β and IL-18 production upon JEV infection in microglia.
NLRP3 is the key PRR involved in the identification of JEV intracellularly in a microglia. The NLRP3 interacts with an adaptor molecule, ASC and recruits pro-caspase-1 forming a biochemical complex termed as inflammasome. In response to JEV, NLRP3 cleaves pro-caspase-1 into its active form, caspase-1. Caspase-1 then cleaves the inactive pro-forms of IL-1β and IL-18 to their mature forms which are then secreted out. ROS and K+ efflux are the host derived danger signals that are critical for the formation of NLRP3 biochemical complex during JEV infection.

References

    1. Krady JK, Basu A, Levison SW, Milner RJ. Differential expression of protein tyrosine kinase genes during microglial activation. Glia. 2002;40:11–24. - PubMed
    1. Levison SW, Druckman SK, Young GM, Basu A. Neural stem cells in the subventricular zone are a source of astrocytes and oligodendrocytes, but not microglia. Dev Neurosci. 2003;25:184–196. - PubMed
    1. Kaushik DK, Gupta M, Basu A. Microglial response to viral challenges: Every silver lining comes with a cloud. Front Biosci. 2011;17:2187–2205. - PubMed
    1. Westaway EG, Brinton MA, Gaidamovich S, Horzinek MC, Igarashi A, et al. Flaviviridae. Intervirology. 1985;24:183–192. - PubMed
    1. Kumar R, Mathur A, Kumar A, Sharma S, Chakraborty S, et al. Clinical features & prognostic indicators of Japanese encephalitis in children in Lucknow (India). Indian J Med Res. 1990;91:321–327. - PubMed

Publication types

MeSH terms