. 2012;7(2):e32533.
doi: 10.1371/journal.pone.0032533. Epub 2012 Feb 28.

Measuring and estimating GFR and treatment effect in ADPKD patients: results and implications of a longitudinal cohort study

Collaborators, Affiliations

Measuring and estimating GFR and treatment effect in ADPKD patients: results and implications of a longitudinal cohort study

Piero Ruggenenti et al. PLoS One. 2012.

Abstract

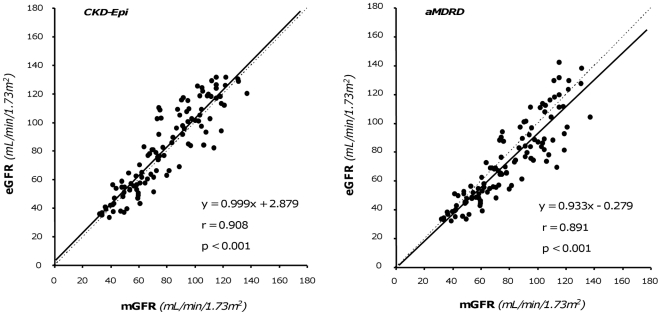
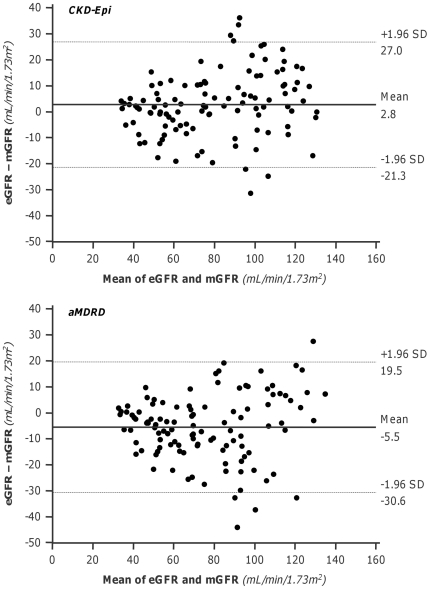
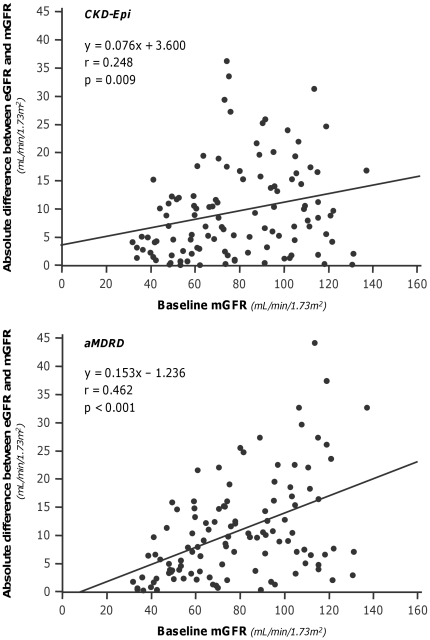
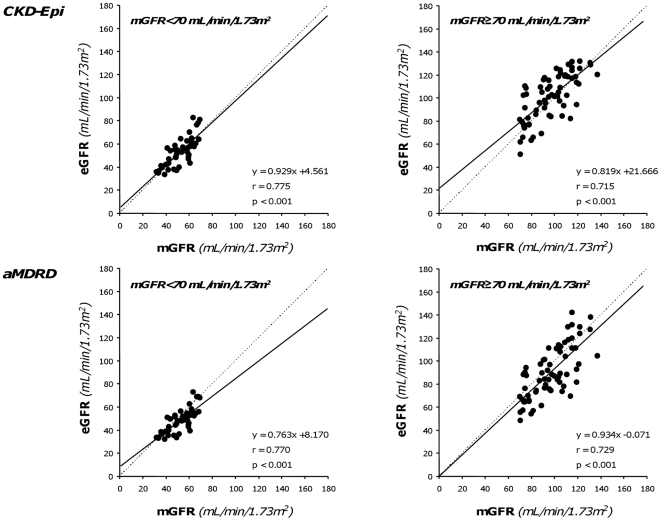
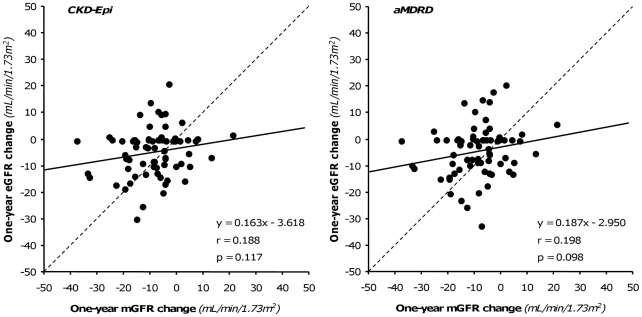
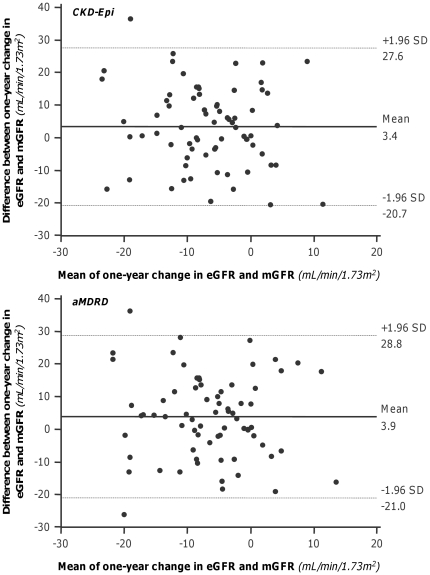
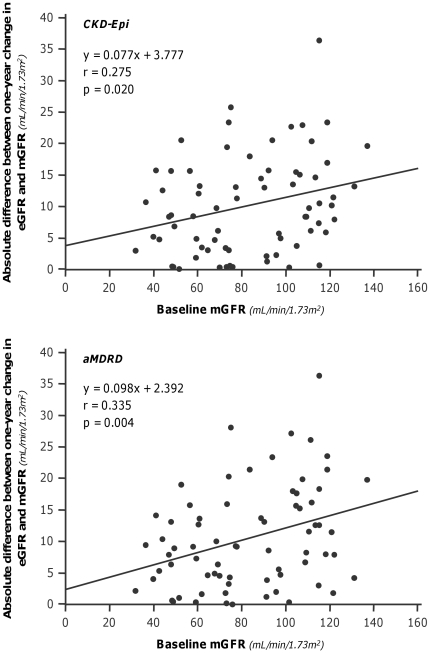
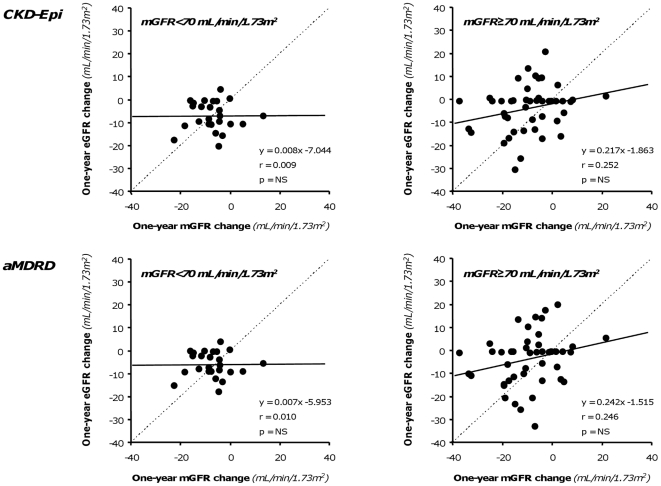
Trials failed to demonstrate protective effects of investigational treatments on glomerular filtration rate (GFR) reduction in Autosomal Dominant Polycystic Kidney Disease (ADPKD). To assess whether above findings were explained by unreliable GFR estimates, in this academic study we compared GFR values centrally measured by iohexol plasma clearance with corresponding values estimated by Chronic Kidney Disease Epidemiology Collaboration (CKD-Epi) and abbreviated Modification of Diet in Renal Disease (aMDRD) formulas in ADPKD patients retrieved from four clinical trials run by a Clinical Research Center and five Nephrology Units in Italy. Measured baseline GFRs and one-year GFR changes averaged 78.6±26.7 and 8.4±10.3 mL/min/1.73 m(2) in 111 and 71 ADPKD patients, respectively. CKD-Epi significantly overestimated and aMDRD underestimated baseline GFRs. Less than half estimates deviated by <10% from measured values. One-year estimated GFR changes did not detect measured changes. Both formulas underestimated GFR changes by 50%. Less than 9% of estimates deviated <10% from measured changes. Extent of deviations even exceeded that of measured one-year GFR changes. In ADPKD, prediction formulas unreliably estimate actual GFR values and fail to detect their changes over time. Direct kidney function measurements by appropriate techniques are needed to adequately evaluate treatment effects in clinics and research.


Conflict of interest statement

Competing Interests: The authors have declared that no competing interests exist.

Figures

Figure 1
Figure 1. Correlation between estimated and measured by iohexol plasma clearance GFR.
Values estimated by CKD-Epi and aMDRD formulas are shown in the left and right panel respectively. Dot lines are identity lines; continuous lines are regression lines.
Figure 2
Figure 2. Agreement between measured and estimated GFR values.
Bland-Altman plot of the difference between GFR estimated (eGFR) by the CKD-Epi (Upper panel) and by aMDRD (Lower panel) formulas and measured GFR (mGFR) vs. the mean of the two determinations. Straight line and dashed lines indicate mean difference and 95% limits of agreement, respectively.
Figure 3
Figure 3. Absolute differences between measured and estimated GFR values vs baseline measured GFR.
The absolute differences significantly increase for both CKD-Epi (Upper panel) and aMDRD (Lower panel) formulas for increasing values of GFR. Continuous lines are regression lines.
Figure 4
Figure 4. Relationship between GFR values ranked according to renal function.
Correlation between GFR measured by iohexol plasma clearance and GFR estimated by the CKD-Epi (Upper panels) and aMDRD (Lower panels) formulas in patients with baseline GFR< or ≥70 mL/min/1.73 m2 considered separately (Left and Right panels, respectively). Dot lines are identity lines; continuous lines are regression lines.
Figure 5
Figure 5. Relationship between measured and estimated 1-year GFR changes.
Correlation between measured 1-year GFR changes vs. baseline and corresponding changes estimated by CKD-Epi (Left panel) and aMDRD (Right panel) formulas. Dot lines are identity lines; continuous lines are regression lines.
Figure 6
Figure 6. Bland-Altman plots of measured and estimated 1-year changes.
Graphs show the agreement between estimated by CKD-Epi (Upper panel) or by aMDRD (Lower panel) formulas and corresponding measured 1-year GFR changes vs. baseline. Straight line and dashed lines indicate mean difference and 95% limits of agreement, respectively.
Figure 7
Figure 7. Absolute differences between measured and estimated 1-year GFR changes vs baseline measured GFR.
The absolute differences between 1-year GFR changes for both CKD-Epi (Upper panel) and aMDRD (Lower panel) formulas significantly increase for increasing values of GFR. Continuous lines are regression lines.
Figure 8
Figure 8. Relationship between 1-year GFR changes ranked according to renal function.
Correlation between measured 1-year GFR changes vs. baseline and corresponding changes estimated by CKD-Epi (Upper panels) and aMDRD (Lower panels) formulas in patients with baseline GFR< or ≥70 mL/min/1.73 m2 considered separately (Left and Right panels, respectively). Dot lines are identity lines; continuous lines are regression lines.

References

    1. Torres VE, Harris PC, Pirson Y. Autosomal dominant polycystic kidney disease. Lancet. 2007;369:1287–1301. - PubMed
    1. Dalgaard OZ. Bilateral polycystic disease of the kidneys; a follow-up of two hundred and eighty-four patients and their families. Acta Med Scand. 1957;Suppl 328:1–255. - PubMed
    1. Stengel B, Billon S, Van Dijk PC, Jager KJ, Dekker FW, et al. Trends in the incidence of renal replacement therapy for end-stage renal disease in Europe, 1990–1999. Nephrol Dial Transplant. 2003;18:1824–1833. - PubMed
    1. King BF, Reed JE, Bergstralh EJ, Sheedy PF, 2nd, Torres VE. Quantification and longitudinal trends of kidney, renal cyst, and renal parenchyma volumes in autosomal dominant polycystic kidney disease. J Am Soc Nephrol. 2000;11:1505–1511. - PubMed
    1. Gabow PA. Autosomal dominant polycystic kidney disease. N Engl J Med. 1993;329:332–342. - PubMed