. 2012 Mar 6;5(214):ra19.
doi: 10.1126/scisignal.2001986.

Akt and ERK control the proliferative response of mammary epithelial cells to the growth factors IGF-1 and EGF through the cell cycle inhibitor p57Kip2

Affiliations

Akt and ERK control the proliferative response of mammary epithelial cells to the growth factors IGF-1 and EGF through the cell cycle inhibitor p57Kip2

Devin T Worster et al. Sci Signal. .

Abstract

Epithelial cells respond to growth factors including epidermal growth factor (EGF), insulin-like growth factor 1 (IGF-1), and insulin. Using high-content immunofluorescence microscopy, we quantitated differences in signaling networks downstream of EGF, which stimulated proliferation of mammary epithelial cells, and insulin or IGF-1, which enhanced the proliferative response to EGF but did not stimulate proliferation independently. We found that the abundance of the cyclin-dependent kinase inhibitors p21Cip1 and p57Kip2 increased in response to IGF-1 or insulin but decreased in response to EGF. Depletion of p57Kip2, but not p21Cip1, rendered IGF-1 or insulin sufficient to induce cellular proliferation in the absence of EGF. Signaling through the PI3K (phosphatidylinositol 3-kinase)-Akt-mTOR (mammalian target of rapamycin) pathway was necessary and sufficient for the increase in p57Kip2, whereas MEK [mitogen-activated or extracellular signal-regulated protein kinase (ERK) kinase]-ERK activity suppressed this increase, forming a regulatory circuit that limited proliferation in response to unaccompanied Akt activity. Knockdown of p57Kip2 enhanced the proliferative phenotype induced by tumor-associated PI3K mutant variants and released mammary epithelial acini from growth arrest during morphogenesis in three-dimensional culture. These results provide a potential explanation for the context-dependent proliferative activities of insulin and IGF-1 and for the finding that the CDKN1C locus encoding p57Kip2 is silenced in many breast cancers, which frequently show hyperactivation of the PI3K pathway. The status of p57Kip2 may thus be an important factor to assess when considering targeted therapy against the ERK or PI3K pathways.


Conflict of interest statement

Competing Interests: The authors declare no competing financial interests.

Figures

Figure 1
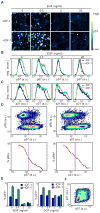
Figure 1. Differential regulation of proliferation and the Akt and ERK pathways by EGF, insulin, and IGF-1
A. Percentage of pRb-positive cells at various EGF concentrations in the absence or presence of 10 ug/ml insulin or 100 ng/ml IGF-1. pRb was detected by HCIF after 24 hours. Values shown indicate the mean +/− SD of triplicate measurements from one representative experiment that was repeated three times. B. Immunofluorescence images of pERK, FoxO3a, and pRb in response to 20 ng/ml EGF or 100 ng/ml IGF-1. Numbers in the lower right indicate the average ratio of nuclear to cytoplasmic staining intensity for Foxo3a. Images are representative of three independent experiments. C. Quantitation of key signaling proteins in cells treated with 20 ng/ml EGF or 100 ng/ml IGF-1. The indicated protein signals were detected by HCIF after 24 hours. Histograms represent distributions of single-cell intensities, where the x-axis represents intensity of the signal, and the y-axis represents the frequency of cells at each intensity normalized with the mode as 1. Data are representative of two independent experiments.
Figure 2
Figure 2. Dynamics of p57 and p21 regulation coordinated by IGF-1 and EGF
A. HCIF images of p57 in response to varying combinations of EGF and IGF-1. MCF-10A cells were treated as in Fig. 1. B,C. Histograms of p57 (B) or p21 (C) abundance determined by HCIF for the conditions shown in (A). D. Covariate single-cell analysis of p21 or p57 and pRb. Top: density scatter plots of p57 or p21 vs. pRb signal for individual cells as measured by HCIF. Bottom: analysis of pRb as a function of p57 or p21 for cells treated with 0.5 ng/ml EGF and 100 ng/ml IGF-1. Individual cell measurements were binned according to p57 or p21 abundance (x-axis), and the percentage of pRb-positive (%Rb+) cells present in each bin was calculated. Curves indicate the mean, and points the individual values, of the %pRb+ for each bin from triplicate measurements. Vertical pink lines denote thresholds for p57 or p21 abundance determined by the midpoint of the decline in %pRb+. E. Frequency of p57- or p21-positive cells under different growth factor conditions, using the thresholds defined in (D). F. Covariate analysis of p21 and p57 abundance for cells treated with 0.5 ng/ml EGF and 100 ng/ml IGF-1. All data shown are from individual experiments representative of at least three independent replicates.
Figure 3
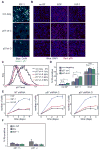
Figure 3. Enhancement of IGF-1-stimulated proliferation in p57-depleted cells
A. HCIF analysis of p57 knockdown. MCF-10A cells stably expressing shRNA hairpins targeting p57 or a non-targeting control hairpin were grown in the presence of 100 ng/ml IGF-1 and the absence of EGF for 2 days. B. HCIF analysis of Proliferative response in p57-depleted cells. Control and p57 shRNA-expressing MCF-10A cells were cultured in the presence of the indicated growth factors for 2 days. C. Quantitation of p57 depletion by shRNA. Histograms represent distributions of p57 intensity for cells cultured as in (A), and knockdown is shown as the percent change in median p57 intensity. D. Quantitation of pRb-positive p57-shRNA cells cultured in the absence of growth factors or the presence of 100 ng/ml IGF-1 or 20 ng/ml EGF for 2 days. Bars represent the average of triplicate wells from one representative experiment, +/− SD. E. Growth curve analysis of p57-depleted cells. MCF-10A cells stably expressing the indicated shRNAs were cultured in the presence of the indicated growth factors. Cell counts were determined by high-throughput imaging of DAPI-stained cells and normalized to the number of cells at the time of treatment. Error bars indicate SD of triplicate wells, and results shown are representative of three independent experiments. F. Quantitation of pRb-positive p21 +/− or −/− MCF-10A cells cultured as in (D). Bars represent the average of three independent wells, +/− SD. All data shown are from individual experiments representative of at least three individual replicates.
Figure 4
Figure 4. Stimulation of p57 by the Akt network
A. HCIF images of MCF-10A cells cultured in the presence of IGF-1 (100 ng/ml) and 1 μM Torin-1, 0.5 μM BEZ-235, 0.2 μM GDC-0941, or 20 nM rapamycin for 24 hr. B. Quantitation of nuclear p57 by HCIF under the conditions shown in (A). Left: histograms of p57 abundance. Right: frequency of the percentage of 57-positive (%p57+) cells. The threshold for p57-positive cells was defined as in Fig. 2; bars indicate the mean, and error bars the range, of duplicate measurements. C. HCIF quantitation of p57 stimulation by inducible myristoylated-Akt. MCF-10A cells stably expressing an inducible Akt variant were cultured in the absence of growth factors for > 48 hr and then stimulated with vehicle (EtOH) or inducer (1μM 4′-OHT) in the presence or absence of 20 ng/ml EGF for the indicated times. D. Timing of p57 induction by Akt measured by HCIF. Cells were treated as in (D) for varying periods of induction prior to fixation. Curves indicate the average, and error bars SD, of four replicate measurements of median p57 intensity. All data shown are from individual experiments representative of at least three independent replicates.
Figure 5
Figure 5. Opposing regulation of p57 mRNA by the Akt and ERK pathways
A. HCIF images of p57 in MCF-10A cells cultured with EGF (20 ng/ml) or IGF-1 (100 ng/ml), in the presence of vehicle (DMSO) or 1 μM MEK inhibitor (PD0325901) for 24 hours. B. Quantitation of p57 intensity for the conditions shown in (A). Histograms represent distributions of p57 abundance, and vertical dashed lines indicate thresholds for p57-positive cells, determined as in Fig. 2. Percentage values indicate the frequency of p57-positive cells for DMSO- (gray) or inhibitor-treated (blue) conditions. C. HCIF analysis of p57 suppression by activated H-Ras. MCF-10A cells stably expressing vector control or H-RasV12 were cultured in the presence of IGF-1 or 1μM MEK inhibitor (PD0325901) for 24 hours. D. HCIF analysis of combined MEK and PI3K-mTOR inhibition. MCF-10A cells were cultured in the presence of 20 ng/ml EGF with or without 1 μM PD0325901 plus 1μM Torin-1, or 0.5 μM BEZ-235 as indicated. E. Summary of p57 intensity as a function of pERK and pAkt abundance. For all conditions shown in Figs. 2A, 4A, and 5A, pERK, pAkt, and p57 were measured by HCIF and shown as a scatter plot; p57 abundance is represented by size and intensity of the symbols. F. Quantitation of p57 mRNA abundance by qPCR. Cells were treated with the indicated conditions for 24 hours. Values shown are the average of four independent experiments, +/− SEM. G. Quantitation by qPCR of p57 mRNA abundance in response to Akt induction. MCF-10A cells stably expressing inducible Akt were cultured as in Fig. 4. Values are the average of three independent experiments, +/− SEM. H,I. Time-dependence of EGF- and IGF- mediated changes in p57 mRNA abundance. H. MCF-10A cells cultured in the presence of IGF-1 were shifted to medium containing IGF-1 and EGF at time 0 (red) or maintained in IGF-1 alone (gray). I. MCF-10A cells cultured in the presence of EGF and IGF-1 were shifted to medium containing only IGF-1 at time 0 (red) or maintained in EGF and IGF-1 (gray). p57 mRNA was quantitated by qPCR at the indicated times. Values and error bars represent the mean and SEM of three independent experiments. Unless otherwise noted, all data shown are from individual experiments representative of at least three independent replicates.
Figure 6
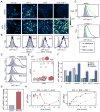
Figure 6. Regulation of p57 in epithelial and cancer cell lines
A, B. Quantitation of p57 by HCIF in (A) MCF-12A mammary epithelial cells and (B) PWR-1E prostate epithelial cells treated with the indicated growth factors and inhibitors of MEK (PD) or PI3K-mTOR (BEZ) for 24 hours. The percentage of p57-positive cells was determined as in Fig. 2. Error bars represent the SD of triplicate wells. C, D. Quantitation of p57 by HCIF in T47D (C) and MD-MBA-468 (D) cells cultured in the presence of the indicated inhibitors of MEK (PD), PI3K and mTOR (BEZ), histone deacetylases (trichostatin A TSA), or DNA methyltransferases (5′-aza-deoxycytidine - AZA) for 24 hours. Bars represent the average p57 intensity of triplicate wells +/− SD. Under some conditions (marked by †) a large percentage of cells committed apoptosis; p57 fluorescence values were derived from surviving cells. E. HCIF images of shRNA-mediated p57 depletion in PIK3CA-mutant cells. MCF-10A cells containing mutant alleles of PIK3CA (E545K or H1047R) at the endogenous locus and stably expressing non-targeting (NT) or p57-specific shRNA were cultured in the absence or presence of EGF for 2 days. F. HCIF images of Rb phosphorylation in PIK3CA mutant cells. Cells were cultured as in (E). G. Quantitation of pRb-positive cells for the conditions in (E). Bars represent the average of three independent wells, +/− SD. H. Growth curve analysis of p57-depleted PIK3CA mutant cells. Cells were cultured as in (E), and cell counts were determined by HCIF analysis of DAPI-stained nuclei. Error bars represent the SD of triplicate wells. All data shown are derived from individual experiments representative of at least three independent replicates.
Figure 7
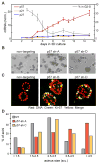
Figure 7. Hyperproliferation in p57-depleted cells in 3D culture
A. Microarray and proliferation analysis of CDKN1 family mRNA abundance in MCF-10A cells during 3D morphogenesis. mRNA abundance for p21, p27, and p57 are shown normalized to the amount on day 2, +/− SEM of triplicate measurements (left vertical axis). The percentage of cells with >2N DNA content (% in G2-S, gray) was assessed by flow cytometry following trypsinization and staining with propidium iodide (right vertical axis). Data shown are from one experiment representative of two independent replicates. B. Phase-contrast images of acinar structures formed by MCF-10A cells transduced with control or p57-targeting shRNA vectors at day 10 in the 3D morphogenesis assay. Data shown are from one experiment representative of four independent replicates. C. Immunofluorescence detection of Ki-67 in control or p57-shRNA acinar structures at day 10 of 3D culture. Data shown are from one experiment representative of two independent replicates. D. Quantitation of acinar structure size for control and p57-shRNA acinar structures at day 17 in 3D culture. Data shown are from one experiment representative of three independent replicates.

References

    1. Chen RH, Sarnecki C, Blenis J. Nuclear localization and regulation of erk- and rsk-encoded protein kinases. Mol Cell Biol. 1992;12:915–927. - PMC - PubMed
    1. Franke TF, Hornik CP, Segev L, Shostak GA, Sugimoto C. PI3K/Akt and apoptosis: size matters. Oncogene. 2003;22:8983–8998. - PubMed
    1. Manning BD. Balancing Akt with S6K: implications for both metabolic diseases and tumorigenesis. J Cell Biol. 2004;167:399–403. - PMC - PubMed
    1. Sears R, Nuckolls F, Haura E, Taya Y, Tamai K, Nevins JR. Multiple Ras-dependent phosphorylation pathways regulate Myc protein stability. Genes Dev. 2000;14:2501–2514. - PMC - PubMed
    1. Mirza AM, Gysin S, Malek N, Nakayama K, Roberts JM, McMahon M. Cooperative regulation of the cell division cycle by the protein kinases RAF and AKT. Mol Cell Biol. 2004;24:10868–10881. - PMC - PubMed

Publication types

MeSH terms

Substances

LinkOut - more resources