

Semi-quantitative immunohistochemical detection of 5-hydroxymethyl-cytosine reveals conservation of its tissue distribution between amphibians and mammals
- PMID: 22395462
- PMCID: PMC3335906
- DOI: 10.4161/epi.7.2.18949
Semi-quantitative immunohistochemical detection of 5-hydroxymethyl-cytosine reveals conservation of its tissue distribution between amphibians and mammals
Abstract
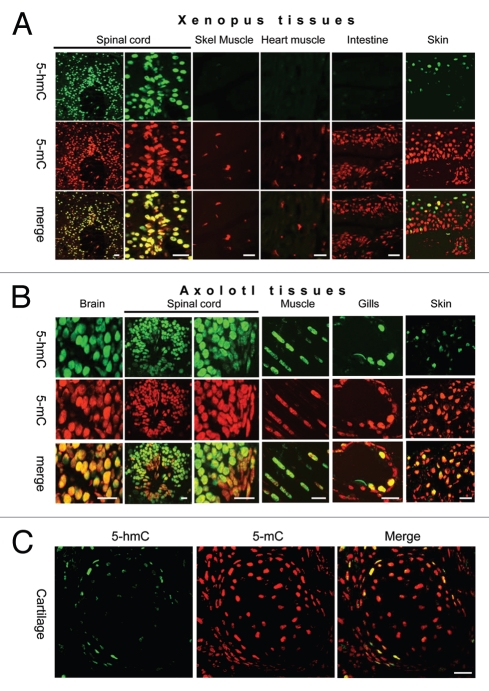
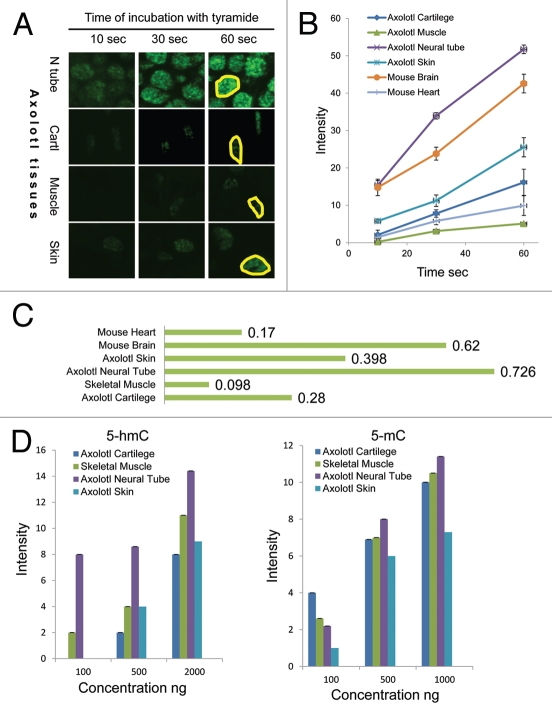
5-Hydroxymethyl-cytosine (5-hmC) is a form of modified cytosine, which has recently attracted a considerable attention due to its potential role in transcriptional regulation. According to several reports 5-hydroxymethyl-cytosine distribution is tissue-specific in mammals. Thus, 5-hmC is enriched in embryonic cell populations and in adult neuronal tissue. Here, we describe a novel method of semi-quantitative immunohistochemical detection of 5-hmC and utilize it to assess the levels of this modification in amphibian tissues. We show that, similar to mammalian embryos, 5-hmC is enriched in axolotl tadpoles compared with adult tissues. Our data demonstrate that 5-hmC distribution is tissue-specific in amphibians, and that strong 5-hmC enrichment in neuronal cells is conserved between amphibians and mammals. In addition, we identify 5-hmC-enriched cell populations that are distributed in amphibian skin and connective tissue in a mosaic manner. Our results illustrate that immunochemistry can be successfully used not only for spatial identification of cells enriched with 5-hmC, but also for the semi-quantitative assessment of the levels of this epigenetic modification in single cells of different tissues.
Figures

Similar articles
-
5-hydroxymethyl-cytosine enrichment of non-committed cells is not a universal feature of vertebrate development.Epigenetics. 2012 Apr;7(4):383-9. doi: 10.4161/epi.19375. Epub 2012 Apr 1. Epigenetics. 2012. PMID: 22419071
-
Lineage-specific distribution of high levels of genomic 5-hydroxymethylcytosine in mammalian development.Cell Res. 2011 Sep;21(9):1332-42. doi: 10.1038/cr.2011.113. Epub 2011 Jul 12. Cell Res. 2011. PMID: 21747414 Free PMC article.
-
5-Carboxylcytosine is localized to euchromatic regions in the nuclei of follicular cells in axolotl ovary.Nucleus. 2012 Nov-Dec;3(6):565-9. doi: 10.4161/nucl.22799. Epub 2012 Nov 1. Nucleus. 2012. PMID: 23138778 Free PMC article.
-
5-Hydroxymethylcytosine--the elusive epigenetic mark in mammalian DNA.Chem Soc Rev. 2012 Nov 7;41(21):6916-30. doi: 10.1039/c2cs35104h. Epub 2012 Jul 27. Chem Soc Rev. 2012. PMID: 22842880 Free PMC article. Review.
-
5-Hydroxymethylcytosine: A new player in brain disorders?Exp Neurol. 2015 Jun;268:3-9. doi: 10.1016/j.expneurol.2014.05.008. Epub 2014 May 17. Exp Neurol. 2015. PMID: 24845851 Free PMC article. Review.
Cited by
-
Age-dependent levels of 5-methyl-, 5-hydroxymethyl-, and 5-formylcytosine in human and mouse brain tissues.Angew Chem Int Ed Engl. 2015 Oct 12;54(42):12511-4. doi: 10.1002/anie.201502722. Epub 2015 Jul 3. Angew Chem Int Ed Engl. 2015. PMID: 26137924 Free PMC article.
-
Planarian MBD2/3 is required for adult stem cell pluripotency independently of DNA methylation.Dev Biol. 2013 Dec 1;384(1):141-53. doi: 10.1016/j.ydbio.2013.09.020. Epub 2013 Sep 21. Dev Biol. 2013. PMID: 24063805 Free PMC article.
-
New Insights into 5hmC DNA Modification: Generation, Distribution and Function.Front Genet. 2017 Jul 19;8:100. doi: 10.3389/fgene.2017.00100. eCollection 2017. Front Genet. 2017. PMID: 28769976 Free PMC article. Review.
-
A B-cell targeting virus disrupts potentially protective genomic methylation patterns in lymphoid tissue by increasing global 5-hydroxymethylcytosine levels.Vet Res. 2014 Oct 23;45(1):108. doi: 10.1186/s13567-014-0108-5. Vet Res. 2014. PMID: 25338704 Free PMC article.
-
Analysis of DNA modifications in aging research.Geroscience. 2018 Feb;40(1):11-29. doi: 10.1007/s11357-018-0005-3. Epub 2018 Jan 11. Geroscience. 2018. PMID: 29327208 Free PMC article. Review.
References
Publication types
MeSH terms
Substances
Grants and funding
LinkOut - more resources
Full Text Sources
Molecular Biology Databases