. 2012 Mar;24(3):1188-201.
doi: 10.1105/tpc.112.096438. Epub 2012 Mar 6.

Pulsing of membrane potential in individual mitochondria: a stress-induced mechanism to regulate respiratory bioenergetics in Arabidopsis

Affiliations

Pulsing of membrane potential in individual mitochondria: a stress-induced mechanism to regulate respiratory bioenergetics in Arabidopsis

Markus Schwarzländer et al. Plant Cell. 2012 Mar.

Abstract

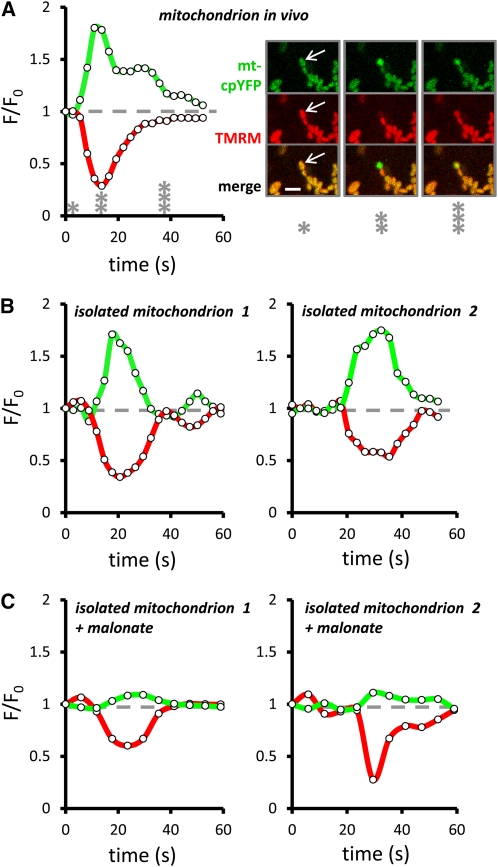
Mitochondrial ATP synthesis is driven by a membrane potential across the inner mitochondrial membrane; this potential is generated by the proton-pumping electron transport chain. A balance between proton pumping and dissipation of the proton gradient by ATP-synthase is critical to avoid formation of excessive reactive oxygen species due to overreduction of the electron transport chain. Here, we report a mechanism that regulates bioenergetic balance in individual mitochondria: a transient partial depolarization of the inner membrane. Single mitochondria in living Arabidopsis thaliana root cells undergo sporadic rapid cycles of partial dissipation and restoration of membrane potential, as observed by real-time monitoring of the fluorescence of the lipophilic cationic dye tetramethyl rhodamine methyl ester. Pulsing is induced in tissues challenged by high temperature, H(2)O(2), or cadmium. Pulses were coincident with a pronounced transient alkalinization of the matrix and are therefore not caused by uncoupling protein or by the opening of a nonspecific channel, which would lead to matrix acidification. Instead, a pulse is the result of Ca(2+) influx, which was observed coincident with pulsing; moreover, inhibitors of calcium transport reduced pulsing. We propose a role for pulsing as a transient uncoupling mechanism to counteract mitochondrial dysfunction and reactive oxygen species production.


Figures

Figure 1.
Figure 1.
Membrane Potential of Individual Mitochondria in Arabidopsis Root Epidermal Cells. (A) Colocalization of TMRM (20 nM; red) with mito-GFP (green) and merged overlay of both channels in two neighboring root cells (cell wall shows some unspecific signal in the TMRM channel). (B) Images at three time points of several mitochondria (same color coding as in [A]); one of which underwent a pulse (indicated by arrow). Bars = 2 μm. (C) Corresponding fluorescence intensity traces of TMRM (red) and mito-GFP (green) for the mitochondrion highlighted in (B). More than 300 cells were assessed and similar events were found consistently. A typical event is shown.
Figure 2.
Figure 2.
Effect of Abiotic Stress on the Occurrence of Pulsing and Mitochondrial Redox Status in Arabidopsis Root Epidermal Cells. (A) The rate of mitochondrial pulsing in epidermal root cells expressing mito-GFP and stained with TMRM (20 nM) in response to heat, oxidative, salt, osmotic, and heavy metal stress treatments (in 0.5× MS medium). n ≥ 4 cells/roots; 85 mitochondria were scored on average per biological replicate. Mean and 95% confidence band are shown as error bars after back-transforming from a square root transformation. *P <0.05 and **P < 0.01 (t test). (B) Mitochondrial redox status in epidermal root cells. Percentage of oxidized roGFP1 in mitochondria indicating the degree of oxidative stress in response to the respective abiotic stress treatments in (A). n = 5 roots; error bars = se, *P ≤ 0.05 and **P ≤ 0.01 (t test).
Figure 3.
Figure 3.
Membrane Potential Pulsing in Isolated Arabidopsis Mitochondria. (A) Mitochondria isolated from mito-GFP seedlings and energized with succinate (10 mM) in minimal medium containing 100 nM TMRM. Red, TMRM; green, mito-GFP. Bar = 2 μm. (B) and (C) Fluorescence intensity traces of six representative mitochondria shown in (A). TMRM signal (B) and corresponding mito-GFP reference signal (C).
Figure 4.
Figure 4.
A Screen for Inhibition of Pulsing in Isolated Arabidopsis Mitochondria. Pharmacological manipulation of mitochondrial electron transport (A) and inner membrane channels (B). The mean CV of the TMRM signal of single mitochondria is used as a measure of pulsing activity. Mitochondria in minimal medium were supplemented with a respiratory substrate, oligomycin (25 μM), to inhibit ATP-synthase and BSA (0.1% [w/v]) to sequester free fatty acids that can cause uncoupling. (A) Pulsing activities during different electron transport modes driven by either succinate (succ), ferrocyanide (fer), or pyruvate/malate (pyr/mal) as respiratory substrates and inhibition of complex III or IV by myxothiazol (myx) or potassium cyanide (KCN), respectively (see Supplemental Table 1 online). n > 450; error bars = se. (B) Change of pulsing activity, as measured by fold change in mean CV, in response to different inhibitors of mitochondrial inner membrane channels and redox-active compounds (see Supplemental Table 2 online). Atr, Atractosylide; CsA, cyclosporin A; DIDS, dithiocyanostilbene disulfonate; DTE, dithioerythritol; EGTA 150, 150 μM EGTA; EGTA 300, 300 μM EGTA; Glyb, glyburide; LaCl3, lanthanum chloride; NEM, N-ethylmaleimide; RuRed, ruthenium red; Ryan, ryanodine; succ, succinate; Temp, Tempol. Respiration was driven by 10 mM succinate. n > 150. Error bars = 95% confidence interval (logarithmic transformation) on the ratio of mean CV (with effector treatment) to mean CV (in corresponding control experiment). **P ≤ 0.01 (Bonferroni corrected).
Figure 5.
Figure 5.
Mitochondrial TMRM Transients Are Coincident with an Increase in Matrix pH in Vivo and in Isolated Mitochondria. (A) A single mitochondrion undergoing a pulse in a living Arabidopsis root. Normalized fluorescence intensity (488-nm excitation) of mt-cpYFP expressed in the mitochondrial matrix (green) and TMRM intensity (red) are plotted. Confocal images captured at the three time points are indicated by asterisks (right); green, mt-cpYFP; red, TMRM. Bar = 2 μm. (B) mt-cpYFP and TMRM fluorescence dynamics during pulses in each of two individual mitochondria (1 and 2), energized with succinate (10 mM) in minimal medium. (C) As in (B) but electron transport capacity was limited by the addition of 1 mM malonate. Representative events are shown.
Figure 6.
Figure 6.
The Effect of Different Cations on cpYFP Fluorescence in Isolated Mitochondria. Isolated mitochondria from mt-cpYFP Arabidopsis seedlings in minimal medium free of added metal ions (0.3 M Suc and 10 mM TES, pH 7.2 [Tris]) undergoing state 2 respiration (by provision with 10 mM Tris-succinate, pH 7.2) were supplemented with 100 μM or 1 mM NaCl, KCl, MgCl2, or CaCl2. The response of mt-cpYFP fluorescence intensity (excitation 485 nm/emission 535 nm) was determined in the absence (A) and presence (B) of 5 mM Tris-phosphate, pH 7.2, which increases matrix pH buffering capacity. n = 3, error bars = se, *P ≤ 0.05, and **P ≤ 0.01 (t test). The experiment was repeated three times with similar results.
Figure 7.
Figure 7.
Membrane Potential Pulses Coincide with a Transient Increase in Free Calcium Levels in Isolated Mitochondria. Isolated Fluo-4 loaded wild-type Arabidopsis mitochondria were monitored by confocal microscopy upon energization in the presence of 100 nM TMRM. Intensities of Fluo-4 (green) and TMRM (red) signals from three single mitochondria are shown. More than 40 mitochondria were analyzed in three independent experiments, and consistent behavior was observed. Representative events are shown.
Figure 8.
Figure 8.
A Model of Mitochondrial Pulsing. (A) A high membrane potential and a low pH gradient contribute to the motive force. The rate of electron transport is thermodynamically limited by proton motive force, leading to ROS release. (B) A channel opens in an ETC-dependent fashion (possibly due to ROS), allowing influx of divalent cations, such as calcium, into the matrix. The charge influx uncouples the mitochondrion, lowers the membrane potential, and removes the constraint on the rate of electron transport, thereby decreasing ROS release. The rate of electron transport increases, as does the rate of proton pumping, leading to increased matrix pH. (C) The channel closes and cations are electroneutrally exported from the matrix in exchange for protons (directly or indirectly), reestablishing matrix pH and membrane potential. Note that charge stoichiometry is not considered in the schematic representation.

References

    1. Allen J.F. (2003). The function of genomes in bioenergetic organelles. Philos. Trans. R. Soc. Lond. B Biol. Sci. 358: 19–37, discussion 37–38 - PMC - PubMed
    1. Aon M.A., Cortassa S., Marbán E., O’Rourke B. (2003). Synchronized whole cell oscillations in mitochondrial metabolism triggered by a local release of reactive oxygen species in cardiac myocytes. J. Biol. Chem. 278: 44735–44744 - PubMed
    1. Arrieta-Montiel M.P., Shedge V., Davila J., Christensen A.C., Mackenzie S.A. (2009). Diversity of the Arabidopsis mitochondrial genome occurs via nuclear-controlled recombination activity. Genetics 183: 1261–1268 - PMC - PubMed
    1. Azarias G., Chatton J.Y. (2011). Selective ion changes during spontaneous mitochondrial transients in intact astrocytes. PLoS ONE 6: e28505. - PMC - PubMed
    1. Balk J., Pilon M. (2011). Ancient and essential: The assembly of iron-sulfur clusters in plants. Trends Plant Sci. 16: 218–226 - PubMed

Publication types

MeSH terms