. 2012 Mar 6:3:719.
doi: 10.1038/ncomms1711.

Dimensional and temporal controls of three-dimensional cell migration by zyxin and binding partners

Affiliations

Dimensional and temporal controls of three-dimensional cell migration by zyxin and binding partners

Stephanie I Fraley et al. Nat Commun. .

Abstract

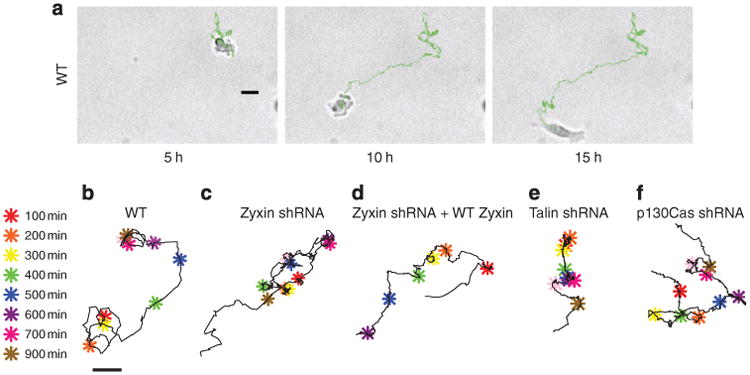
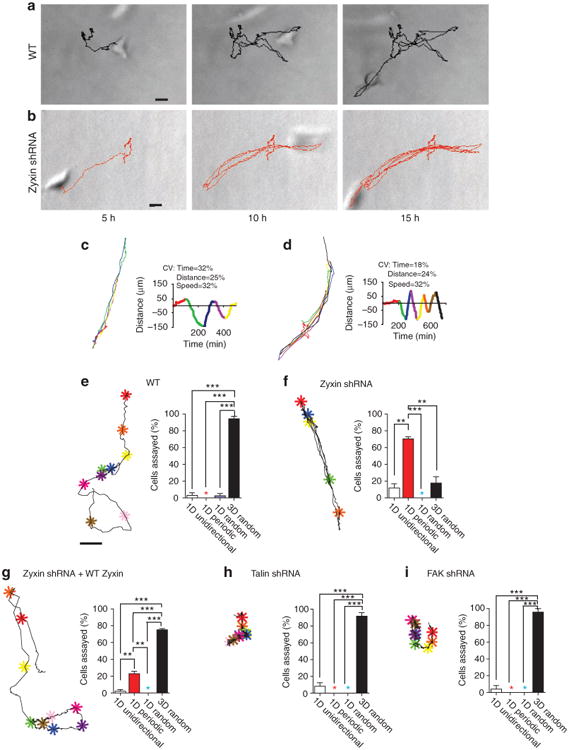
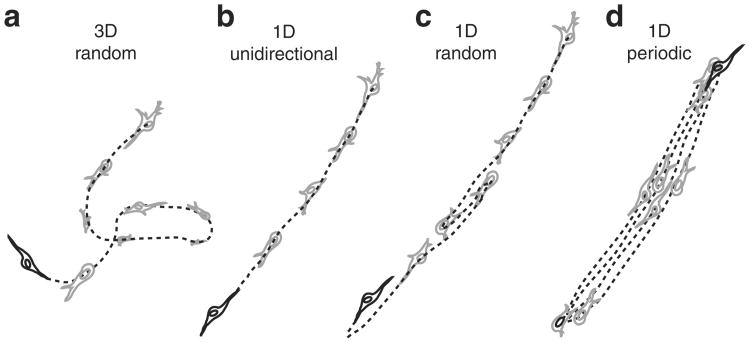
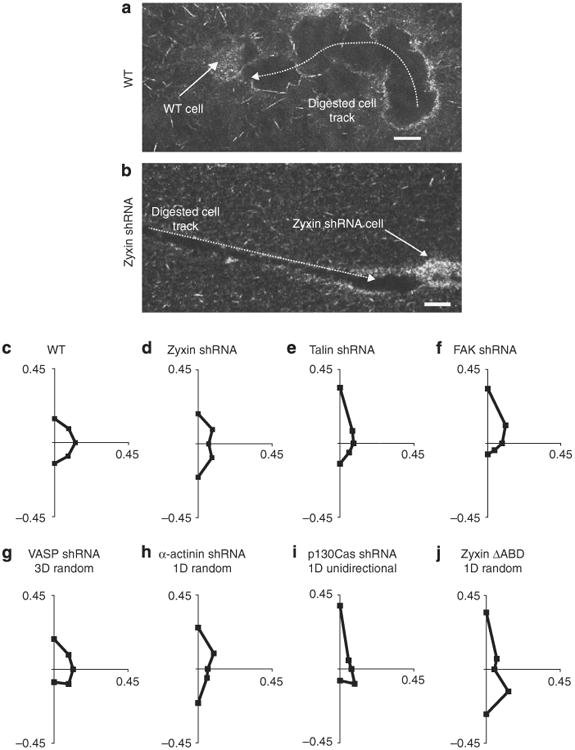
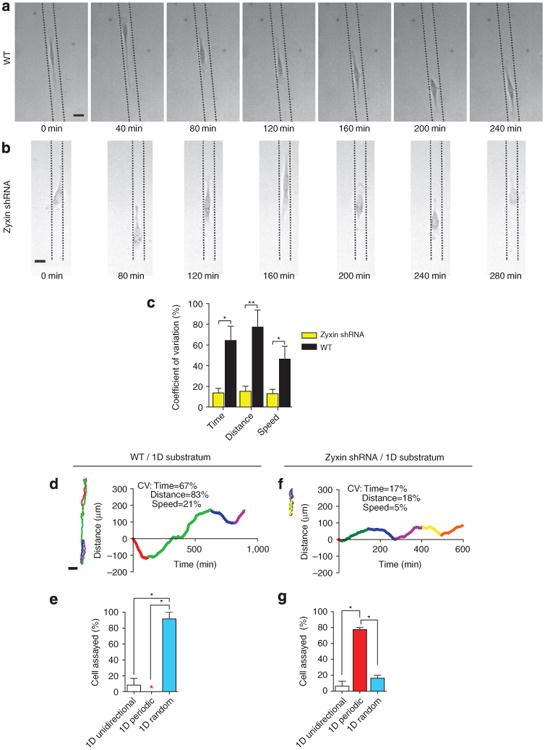
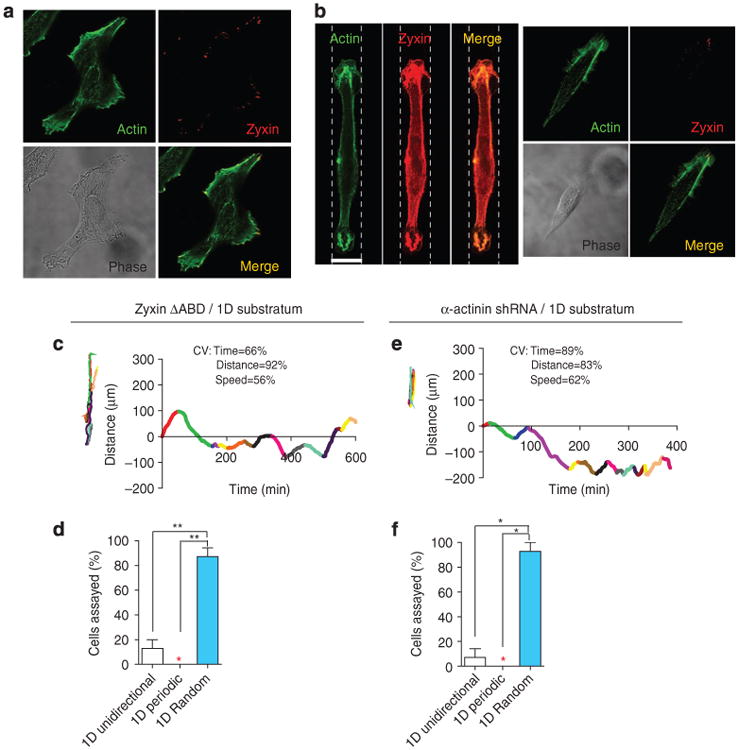
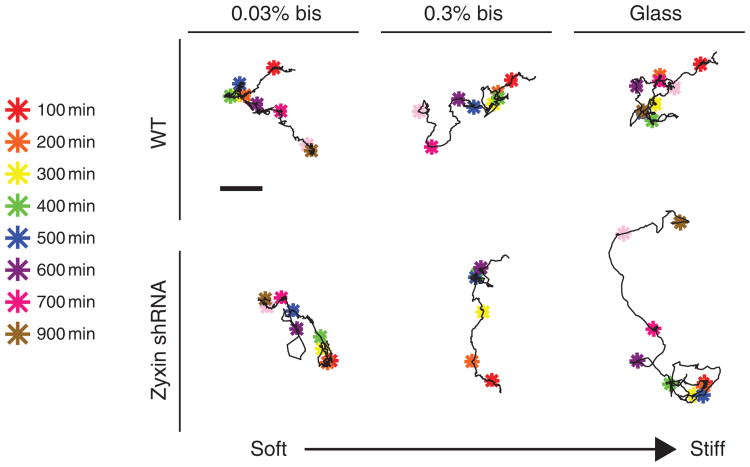
Spontaneous molecular oscillations are ubiquitous in biology. But to our knowledge, periodic cell migratory patterns have not been observed. Here we report the highly regular, periodic migration of cells along rectilinear tracks generated inside three-dimensional matrices, with each excursion encompassing several cell lengths, a phenotype that does not occur on conventional substrates. Short hairpin RNA depletion shows that these one-dimensional oscillations are uniquely controlled by zyxin and binding partners α-actinin and p130Cas, but not vasodilator-stimulated phosphoprotein and cysteine-rich protein 1. Oscillations are recapitulated for cells migrating along one-dimensional micropatterns, but not on two-dimensional compliant substrates. These results indicate that although two-dimensional motility can be well described by speed and persistence, three-dimensional motility requires two additional parameters, the dimensionality of the cell paths in the matrix and the temporal control of cell movements along these paths. These results also suggest that the zyxin/α-actinin/p130Cas module may ensure that motile cells in a three-dimensional matrix explore the largest space possible in minimum time.


Figures

Figure 1
Figure 1. Cells depleted of zyxin or other focal adhesion proteins undergo temporally random migration on a 2D substrate
(a) Evolution of a typical trajectory of a single WT cell placed on a conventional 2D collagen I-coated glass substrate. Scale bar represents 20 μm. (b–f) Typical trajectories of a single WT cell (b), zyxin-depleted cell (c), zyxin-depleted cell where WT zyxin was re-expressed (d), talin-depleted cell (e) and p130Cas-depleted cell (f) placed on flat 2D collagen I-coated glass substrates. These trajectories are confined to the 2D plane of the substrate and are temporally random. Colour-coded asterisks indicate cell positions along the 1,000-min long trajectories at 100-min time intervals. Scale bar in panel (b) represents 20 μm and applies to all trajectories. Single-cell trajectories in panels (bf) are representative of the most abundant motile phenotype for each case.
Figure 2
Figure 2. Zyxin mediates the 3D temporally random migration of single tumour cells in a 3D matrix
(a,b) Evolution of a typical random trajectory of a single WT cell (a) and typical evolution of a highly regular oscillatory trajectory of a single zyxin-depleted cell (b), both fully embedded inside a 3D collagen I matrix. Scale bar represents 20 μm. (c,d) Representative trajectories and corresponding time-dependent displacements along 1D tracks of two matrix-embedded zyxin-depleted cells (top and bottom panels). Each unidirectional movement of the cell, until it moved in the opposite direction, was colour-coded for ease of visualization. The right panels show the time-dependent displacements along the 1D paths in colours corresponding to the excursions shown in the left panels. Coefficients of variations (CV) of lengths and durations of the 1D periodic excursions are noted. (e–i) Typical trajectory (left) and percentages (right) of individual WT cells (e) and zyxin-depleted cells (f), zyxin-depleted cells where FH tagged-zyxin was expressed (g), talin-depleted cells (h), FAK-depleted cells (i) showing either a 1D unidirectional (white bar), 1D periodic (red bar), 1D random (blue bar), or conventional migration phenotype that was both 3D and temporally random (black bar). A coloured star indicates a value of zero. Colour-coded asterisks indicate cell positions along the 1,000-min long trajectories at 100-min time intervals. Scale bar in panel (e) represents 20 μm and applies to all trajectories. Single-cell trajectories in panels (a), (b) and (ei) are representative of the most abundant motile phenotype for each case. Bar graphs show percentages of cells undergoing different modes of motility within each shRNA population; N = 3 biological repeats averaged for each graph; at least 30 cells were analysed. ***P < 0.001; **P < 0.01; *P < 0.05.
Figure 3
Figure 3. Schematic of time-dependent trajectories of cells fully embedded inside 3D matrices
(a) Conventional 3D random migration, as observed with WT cells and cells depleted of focal adhesions proteins such as vinculin, talin, FAK and VASP. (b) 1D unidirectional migration, as observed with p130Cas-depleted cells. (c) 1D random migration, as observed with α-actinin-depleted cells. (d) 1D periodic migration, as observed with zyxin-depleted cells (see also classification in Table 1).
Figure 4
Figure 4. Regulation of dimensionality and temporal character of cellular migration by binding partners of zyxin
(a-d) Types of migration of α-actinin-depleted cells (a), VASP-depleted cells (b), 130Cas-depleted cells (c) and cysteine-rich protein 1 (CRP-1)-depleted cells (d) embedded in a 3D collagen I matrix for 12-h observation time. Cells displayed either 1D highly persistent (unidirectional) migration (white bars), 1D periodic oscillatory migration (red bars), 1D random migration (blue bars), or 3D random migration (black bars) inside the 3D matrix. A coloured star indicates a value of zero. Insets, typical trajectories of the corresponding cells. Colour-coded asterisks indicate cell positions along the 1,000-min long trajectories at 100-min time intervals. Scale bar in panel (a), 20 μm, applies to all trajectories in the insets of Fig. 4. (e). Schematic of the protein zyxin, which contains domains that bind to α-actinin, VASP and LIM domains that bind p130Cas. (f,g) Fractions of zyxin VBDmu cells (a zyxin mutant that cannot bind VASP) (f) and zyxin ΔABD cells (a zyxin mutant that lacks its α-actinin binding domain) (g) that undergo either 1D highly persistent (unidirectional) migration (white bars), 1D oscillatory migration (red bars), 1D random migration (blue bars), or 3D random migration (black bars) inside the 3D matrix. Insets, typical trajectories of the corresponding cells. Bar graphs in panels (a-d, f,g) show percentages of cells undergoing different modes of motility within each shRNA population N = 3 biological repeats averaged for each graph; at least 30 cells were analysed for each condition. ***P < 0.001; **P < 0.01; *P < 0.05.
Figure 5
Figure 5. Regulation of cellular protrusion orientation and migratory patterns by zyxin and binding partners
(a,b) Confocal reflection micrographs of typical tracks generated by an individual WT cell (a) and a zyxin-depleted cell (b) fully embedded inside a collagen I matrix. Scale bars represent 20μm. (c-j) Angular distributions of pseudopodial protrusions displayed by WT cells (c), zyxin-depleted cells (d), talin-depleted cells (e), FAK-depleted cells (f), VASP-depleted cells (g), α-actinin-depleted cells (h), p130Cas-depleted cells (i) and zyxin ΔABD cells (j) along the periphery of cells fully embedded inside a 3D matrix for a 12-h observation time. For each case, the direction of the first recorded protrusion is arbitrarily taken as pointing north, corresponding to the positive y axis of the graphs. Axes labels represent the fraction of the total number of protrusions, measured across multiple cells, which occurred in each radial direction about the centroid of the cells during the 12-h observation. Graphs of protrusion orientation summarize results within the specified mode of motility sub-population for a minimum of 100 protrusions and 8 cells over 12 h. Supplementary Figure S3 explains the methodology used to determine the orientation of protrusions in further detail.
Figure 6
Figure 6. The oscillatory motion of zyxin-depleted cells in 3D matrix is recapitulated on 1D confining stripes on flat substrates
(a,b) Typical random 1D movements of WT cells (a) and periodic oscillatory 1D movements of zyxin-depleted cells (b) confined to collagen-I-coated, 20-μm-wide stripes flanked by non-adhesive 10-μm-wide polyethylene glycol stripes on substrates. Dotted lines on micrographs represent borders of the patterned collagen stripe on which the cell is migrating. Scale bar represents 20 μm. (c) Coefficients of variations of the length, duration and cell speed during each unidirectional excursion of WT and zyxin-depleted cells on 1D stripes. (d–g) Typical colour-coded trajectories (left) and corresponding time-dependent movements along the 1D stripes (right) of the WT cells (d,e) and zyxin-depleted cells (f,g) on 1D stripes. CV, coefficients of variations. Migration of the cells along the 1D stripes were either 1D unidirectional (white bars), 1D periodic (red bars), or 1D random (blue bars). Bar graph in (c), the excursions of at least eight cells were analysed for WT and zyxin shRNA. Remaining bar graphs show percentages of cells undergoing different modes of migration within each shRNA population. N = 3 biological repeats averaged for each graph; at least 25 cells were analysed for each graph. **P < 0.01; *P < 0.05.
Figure 7
Figure 7. One-dimensional confining stripes recapitulate zyxin and actin localization of cells in 3D matrix and recapitulate the role of α-actinin in cellular migratory patterns
(a,b) Confocal micrographs of individual WT cells on flat collagen-coated 2D substrates (a) or 20-μm-wide collagen-coated stripes (b). Cells were stained for F-actin (green) and zyxin (red). Images were focused on the ventral side of the cells. Scale bar represents 20μm. Outlines of 1D micropatterns are shown with dotted lines. (c-f) Typical colour-coded trajectories (left, c,e) and corresponding time-dependent movements along the 1D stripes (right, c,e) of zyxin ΔABD cells (c,d) and α-actinin-depleted cells (e,f). CV, coefficients of variations. Fractions of cells showing either 1D unidirectional migration (white bars), 1D periodic oscillatory migration (red bars), or 1D random migration (blue bars) are displayed in panels (d) and (f). A coloured star indicates a value of zero. Bar graphs show percentages of cells undergoing different modes of migration within each shRNA population; at least 25 cells were analysed for each graph. **P < 0.01; *P < 0.05
Figure 8
Figure 8. The 1D/oscillatory motion of zyxin-depleted cells in 3D matrix is not recapitulated on compliant surfaces
Typical trajectories of WT cells (top) and zyxin-depleted cells (bottom) placed on very compliant (0.03% bis concentration in polyacrylamide gels), compliant (0.3% bis concentration) and stiff (glass) collagen-I-coated substrates. Colour-coded asterisks indicate cell positions along the 1,000-min long trajectories at 100-min time intervals. Scale bar (top) is 20 μm and applies to all trajectories. Here, 100% of WT and zyxin-depleted cells on compliant substrates showed 2D random trajectories; none showed 1D migration.

References

    1. Kruse K, Julicher F. Oscillations in cell biology. Curr Opin Cell Biol. 2005;17:20–26. - PubMed
    1. King DP, Takahashi JS. Molecular genetics of circadian rhythms in mammals. Annu Rev Neurosci. 2000;23:713–742. - PubMed
    1. Giannone G, et al. Periodic lamellipodial contractions correlate with rearward actin waves. Cell. 2004;116:431–443. - PubMed
    1. Kruse K, Camalet S, Julicher F. Self-propagating patterns in active filament bundles. Phys Rev Lett. 2001;87:138101. - PubMed
    1. Yoshida T, Katoh A, Ohtsuki G, Mishina M, Hirano T. Oscillating Purkinje neuron activity causing involuntary eye movement in a mutant mouse deficient in the glutamate receptor d2 subunit. J Neurosci. 2004;24:2440–2448. - PMC - PubMed

Publication types