. 2012 Apr 2;53(4):1714-28.
doi: 10.1167/iovs.11-8009.

Biomechanics of the human posterior sclera: age- and glaucoma-related changes measured using inflation testing

Affiliations

Biomechanics of the human posterior sclera: age- and glaucoma-related changes measured using inflation testing

Baptiste Coudrillier et al. Invest Ophthalmol Vis Sci. .

Abstract

Purpose: The objective of this study was to measure the biomechanical response of the human posterior sclera in vitro and to estimate the effects of age and glaucoma.

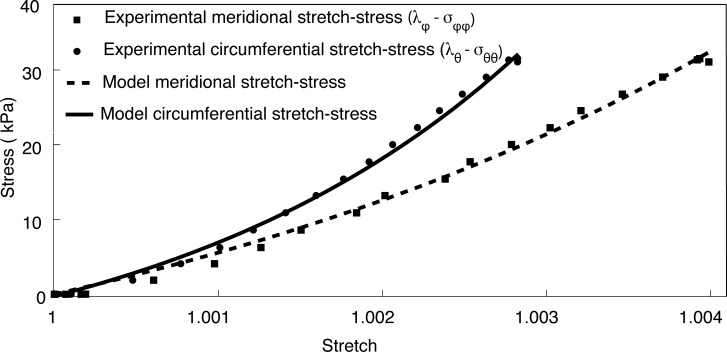
Methods: Scleral specimens from 22 donors with no history of glaucoma and 11 donors with a history of glaucoma were excised 3 mm posterior to the equator and affixed to an inflation chamber. Optic nerve cross-sections were graded to determine the presence of axon loss. The time-dependent inflation response was measured in a series of pressure-controlled load-unload tests to 30 mm Hg and creep tests to 15 and 30 mm Hg. Circumferential and meridional strains were computed from the digital image correlation displacements, and midposterior stresses were determined from pressure and deformed geometry.

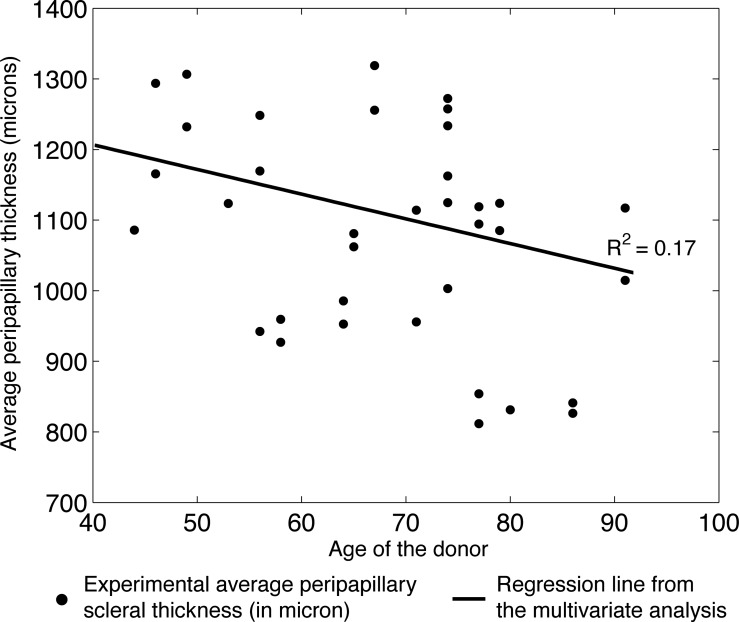
Results: Among normal specimens, older age was predictive of a stiffer response and a thinner sclera. In the age group 75 to 93, diagnosed glaucoma eyes with axon damage were thicker than normal eyes. Both damaged and undamaged glaucoma eyes had a different strain response in the peripapillary sclera characterized by a stiffer meridional response. Undamaged glaucoma eyes had slower circumferential creep rates in the peripapillary sclera than normal eyes. Glaucoma eyes were not different from normal eyes in stresses and strains in the midposterior sclera.

Conclusions: The observed differences in the biomechanical response of normal and glaucoma sclera may represent baseline properties that contribute to axon damage, or may be characteristics that result from glaucomatous disease.


Figures

Figure 1.
Figure 1.
The position of the holder (thick line) glued to the scleral specimen and the standard position of the ONH during testing.
Figure 2.
Figure 2.
(a) Experimental setup. Two charge-coupled device cameras imaged the posterior sclera, which was inflated by pressure-controlled injection of BSS. (b) Posterior sclera glued on the holder 3 mm posterior to the equator. Black dots indicate the location of thickness measurements. These were grouped into two circles of radius 2 and 10 mm centered at the ONH, representing the peripapillary and midposterior region, starting from the nasal pole. The ONH does not appear centered because of the camera angle. (c) The specimen transilluminated and speckled with graphite powder for digital imaging correlation.
Figure 3.
Figure 3.
(a) Side view of the posterior sclera with representation of the midposterior region. (b) Camera view. (c) Definition of the spherical coordinate system to describe the position of points of the midposterior scleral surface. The circumferential direction eθ is parallel to the holder and the meridional direction eφ is tangent to the meridian and perpendicular to eθ.
Figure 4.
Figure 4.
(a) 2D projection of the DIC grid of points of the undeformed surface. (b) 2D projection of the new grid with points aligned in the circumferential and meridional directions. The distance between two consecutive points in eφ is Lφ. (c) 2D projection of the deformed grid. The new distance between the same points in the deformed configuration is lφ. The meridional stretch was calculated as λφ = lφ/Lφ.
Figure 5.
Figure 5.
Membrane stresses are generated in the sclera to equilibrate the applied pressure. They can be calculated from the pressure, thickness of the sclera, and two principal radii of curvature.
Figure 6.
Figure 6.
Stress–stretch response averaged over the midposterior sclera for a normal sclera (age 77). Comparison of experimental results (dots) and model fit (lines).
Figure 7.
Figure 7.
Box plots of the local average thickness in the peripapillary sclera for normal specimens. N, indicates nasal; S, superior; T, temporal; I, inferior; and N/S, means that the location site was in between nasal and superior. Thickness measurements were performed 2 mm from the center of the nerve head. The I/N and N poles were significantly thinner (* indicates P ≤ 0.005) than the S, S/T, and T poles as shown in the schematic on the top right.
Figure 8.
Figure 8.
The inflation response of the sclera of a 77-year-old Caucasian male normal donor. (a) Colored contour map of the magnitude of the displacement vector ( R=ux2+uy2+uz2) with red indicating greater displacement. The ONH is not shown. (b) The displacement magnitude as a function of pressure for a load–unload test to 30 mm Hg at two different loading rates for the point located in the nasal peripapillary region marked with a star in (a). Note that the two first load–unload tests of the rate dependent test series (rate 1 mm Hg/s, curve red and blue) overlapped, indicating that preconditioning the tissue is not necessary. (c) For the same point, the creep tests at 15 and 30 mm Hg showed displacement recovery upon unloading.
Figure 9.
Figure 9.
(a) Circumferential strain Eθθ and (b) Meridional strain Eφφ in both the midposterior and peripapillary sclera for a 77-year-old normal eye.
Figure 10.
Figure 10.
Average peripapillary scleral thickness plotted versus age for normal specimens. The regression line from the model illustrates the age variation of the thickness.
Figure 11.
Figure 11.
(a) Circumferential stress versus circumferential stretch for normal specimens. The age effects on the stiffness are clearly seen by separating the eyes into three age groups. (b) Stiffness of the circumferential fiber family as a function of age for normal specimens. The regression line from the model predicts a threefold increase in the stiffness between age 40 and 80.
Figure 12.
Figure 12.
Averaged peripapillary meridional strain versus pressure for normal, undamaged glaucoma, and damaged glaucoma specimens, illustrating the stiffening observed in the meridional direction for diagnosed glaucoma specimens. The length of the error bar represents one standard deviation.
Figure 13.
Figure 13.
Circumferential stress versus circumferential stretch in the midposterior sclera for normal, damaged, and undamaged glaucoma specimens older than 75. There were no statistically significant differences in stiffness or level of strain at 22.5 mm Hg between glaucoma and normal specimens.

References

    1. Morrison JC, Johnson EC, Cepurna W, Jia L. Understanding mechanisms of pressure-induced optic nerve damage. Prog Retin Eye Res. 2005;24:217–240. - PubMed
    1. Hernandez MR, Pena JDO. The optic nerve head in glaucomatous optic neuropathy. Arch Ophthalmol. 1997;115:389–395. - PubMed
    1. Quigley HA. Neuronal death in glaucoma. Prog in Ret and Eye Res. 1997;18:39–57. - PubMed
    1. Ethier CR. Scleral biomechanics and glaucoma—a connection? Can J Ophthalmol. 2006; 41: 9– 12, 14. - PubMed
    1. Burgoyne CF, Downs JC, Bellezza AJ, Suh JKF, Hart RT. The optic nerve head as a biomechanical structure: a new paradigm for understanding the role of IOP-related stress and strain in the pathophysiology of glaucomatous optic nerve head damage. Prog Retin Eye Res. 2005;24:39–73. - PubMed

Publication types