. 2012 May;61(5):1112-21.
doi: 10.2337/db11-1620. Epub 2012 Mar 6.

Retinoic acid upregulates preadipocyte genes to block adipogenesis and suppress diet-induced obesity

Affiliations

Retinoic acid upregulates preadipocyte genes to block adipogenesis and suppress diet-induced obesity

Daniel C Berry et al. Diabetes. 2012 May.

Abstract

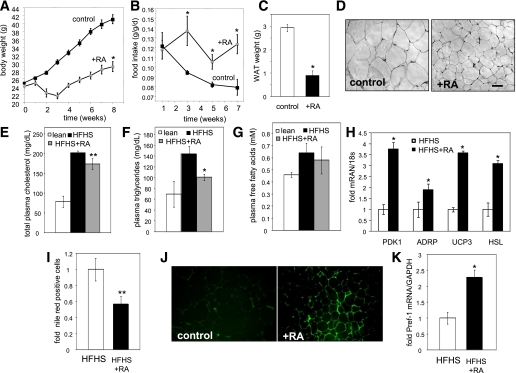
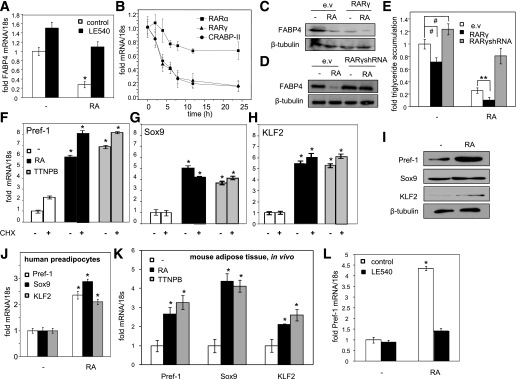
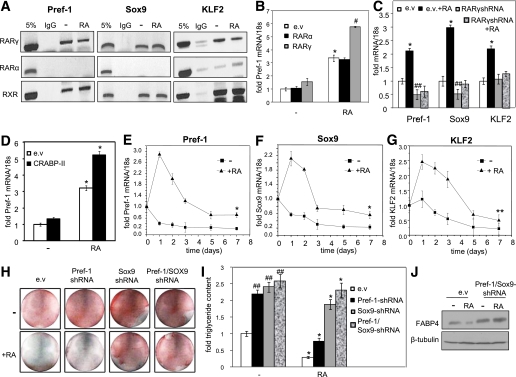
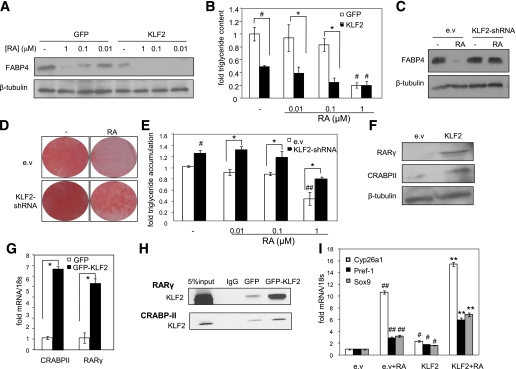
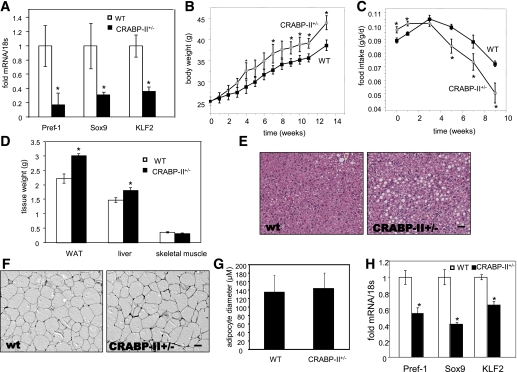
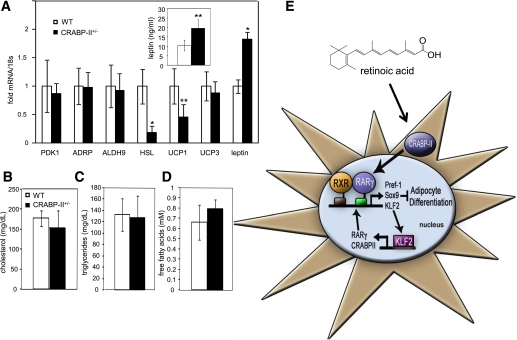
Retinoic acid (RA) protects mice from diet-induced obesity. The activity is mediated in part through activation of the nuclear receptors RA receptors (RARs) and peroxisome proliferator-activated receptor β/δ and their associated binding proteins cellular RA binding protein type II (CRABP-II) and fatty acid binding protein type 5 in adipocytes and skeletal muscle, leading to enhanced lipid oxidation and energy dissipation. It was also reported that RA inhibits differentiation of cultured preadipocytes. However, whether the hormone suppresses adipogenesis in vivo and how the activity is propagated remained unknown. In this study, we show that RA inhibits adipocyte differentiation by activating the CRABP-II/RARγ path in preadipose cells, thereby upregulating the expression of the adipogenesis inhibitors Pref-1, Sox9, and Kruppel-like factor 2 (KLF2). In turn, KLF2 induces the expression of CRABP-II and RARγ, further potentiating inhibition of adipocyte differentiation by RA. The data also indicate that RA suppresses adipogenesis in vivo and that the activity significantly contributes to the ability of the hormone to counteract diet-induced obesity.


Figures

FIG. 1.
FIG. 1.
RA prevents weight gain and inhibits adipogenesis in vivo. A: Body weight of control (black squares) and RA-treated (gray circles) 8-week-old mice fed an HFHS diet (n = 6/group) for 8 weeks. B: Food intake of control (black squares) and RA-treated (gray circles), normalized to body weight (n = 6/group). C: Weights of WAT in control and RA-treated mice (n = 3/group). D: Hematoxylin-eosin staining of adipose tissue of control and RA-treated mice. Plasma levels of total cholesterol (E), triglycerides (F), and free fatty acids (G) in lean mice (white bars), mice fed an HFHS diet for 8 weeks (black bars), and HFHS-fed RA-treated mice (HFHS+RA, gray bars). H: Levels of mRNA for denoted genes in WAT of untreated, HFHS-fed (white bars) and HSHF-fed, RA-treated mice (black bars). I: Cells were isolated from WAT of denoted mice, stained with Hoechst dye and Nile red, and analyzed by flow cytometry. Total of 10,000 cells was analyzed, and the fraction of Nile red-positive cells is shown. J: Pref-1 expression in WAT was visualized by immunofluorescence. K: Stromal vascular fraction was isolated from WAT and Pref-1 mRNA measured by quantitative real-time PCR (Q-PCR). Data are means ± SEM. n = 3/group unless denoted otherwise. *P ≤ 0.01; **P ≤ 0.03 HFHS-fed mice in the absence versus presence of RA treatment. (A high-quality digital representation of this figure is available in the online issue.)
FIG. 2.
FIG. 2.
RA induces the expression of the adipogenesis inhibitors Pref-1, Sox9, and KLF2. A: Levels of FABP4 mRNA in cells differentiated in the presence of RA, LE540, or both (1 μmol/L). *P ≤ 0.01 control versus treated. B: Levels of RARα (■), RARγ (▲), and CRABP-II (●) mRNA of during the first 24 h of adipocyte differentiation. Preadipocytes were transfected with empty vector (e.v) or vector encoding RARγ (C) or infected with lentivirus encoding RARγ-shRNA (D) and then induced to differentiate in the absence or presence of RA (1 μmol/L). FABP4 expression was assessed by immunoblots. E: Triglyceride content of adipocytes treated as in C and D. #P ≤ 0.03 cells expressing e.v versus vector harboring RARγ or lentivirus encoding RARγ-shRNA; **P < 0.01 cells treated with RA expressing e.v versus vector harboring RARγ. FH: Levels of denoted mRNAs in preadipocytes pretreated with cycloheximide (CHX; 15 min, 20 μg/mL) and then treated with vehicle (white bars), RA (black bars), or TTNPB (gray bars) (0.1 μmol/L, 4 h). *P ≤ 0.01 control versus treated cells. I: Preadipocytes were treated with vehicle or RA (1 μmol/L, 8 h) and levels of Pref-1, Sox9, and KLF2 assessed by immunoblots. J: Levels of denoted mRNAs in human preadipocytes treated with vehicle or RA (0.1 μmol/L, 4 h). *P ≤ 0.01 control versus treated. K: Levels of denoted mRNAs in adipose tissue of 22-week-old obese mice orally fed with vehicle (sesame oil, white bars), RA (black bars), or TTNPB (gray bars) daily for 2 days (0.16 mg ligand/day). n = 3/group. *P ≤ 0.01 control versus RA-treated. L: Preadipocytes were pretreated with LE540 (1 μmol/L, 1 h) and then treated with vehicle (white bars) or RA (black bars) (1 μmol/L, 4 h). Pref-1 mRNA was measured by Q-PCR. Data are means ± SD from three independent experiments.
FIG. 3.
FIG. 3.
Pref-1, Sox9, and KLF2 are direct RAR target genes and mediate RA-induced inhibition of adipogenesis. A: ChIP analysis of RAREs located in the promoters of denoted genes. Analyses were carried out using antibodies against denoted RARs. A pan-RXR antibody was used to examine the recruitment of this receptor. B: Preadipocytes were transfected with vectors encoding empty vector (e.v, white bars), RARα (black bars), or RARγ (gray bars) for 24 h. Overexpression was verified by immunoblots (Supplementary Fig. 2C). Cells were then treated with RA (0.1 μmol/L, 4 h). Pref-1 mRNA was measured by Q-PCR. *P < 0.01 control versus RA-treated; #P < 0.01 RA-treated empty virus-expressing cells versus RA-treated RARγ-expressing cells. C: Preadipocytes were infected with lentivirus encoding RARγ-shRNA or empty virus. Reduced expression was verified by immunoblots (Supplementary Fig. 2C). Cells were then treated with RA (0.1 μmol/L, 4 h). Levels of denoted mRNAs were assessed by Q-PCR. *P < 0.01 control versus RA-treated; ##P < 0.05 nontreated empty virus–expressing cells versus nontreated denoted shRNA-expressing cells. D: Preadipocytes were infected with empty adenovirus (e.v, white bars) or adenovirus encoding CRABP-II (black bars); 24 h later, cells were treated or not with RA (1 μmol/L, 4 h). Pref-1 mRNA was measured by Q-PCR. *P < 0.01 control versus RA-treated cells. E–G: NIH-3T3-L1 cells were induced to differentiate, and levels of mRNAs for denoted genes were monitored throughout differentiation in the absence (■) or presence of RA (+RA, ▲) (1 μmol/L). RA was replenished every 2 days. *P < 0.01 control versus RA-treated; **P < 0.05 control versus RA-treated. H–J: Preadipocytes stably expressing shRNA for Pref-1, Sox9, or both were induced to differentiate in the presence of RA (1 μmol/L). Adipocyte differentiation was monitored by Oil Red O staining (H), by measuring triglyceride content (I), and by immunoblotting FABP4 (J). *P < 0.01 control versus RA-treated; ##P < 0.05 nontreated e.v-expressing cells versus nontreated cells expressing denoted shRNA. Data are means ± SD from three independent experiments.
FIG. 4.
FIG. 4.
RA inhibits adipogenesis through KLF2, which, in turn, feeds back onto RA signaling. A: Preadipocytes were infected with retroviruses encoding green fluorescent protein (GFP) or GFP-KLF2 and treated with denoted concentrations of RA throughout differentiation. RA was replenished every 48 h. FABP4 expression was monitored by immunoblots. B: Preadipocytes, infected with retroviruses encoding GFP (white bars) or GFP-KLF2 (black bars), were induced to differentiate in the presence of denoted concentrations of RA. Triglyceride content was measured. #P ≤ 0.01 cells infected with GFP versus GFP-KLF2–encoding vector; *P < 0.05 RA-treated cells expressing GFP versus RA-treated GFP-KLF2–expressing cells. C–E: Preadipocytes were infected with an empty lentivirus (e.v, white bars) or lentivirus encoding KLF2-shRNA (black bars) and induced to differentiate in the absence or presence of RA (1 μmol/L). Differentiation was monitored by immunoblotting for FABP4 (C), Oil Red O staining (D), and measuring triglyceride content (E). #P ≤ 0.01 cells infected with GFP versus GFP-KLF2–encoding vector; *P < 0.05 RA-treated cells expressing GFP versus RA-treated GFP-KLF2–expressing cells; ##P < 0.001 RA-treated versus nontreated cells. F: Preadipocytes were infected with retrovirus encoding KLF2. Expression levels of denoted proteins were analyzed by immunoblotting. G: Preadipocytes were infected with retroviruses encoding GFP (white bars) or GFP-KLF2 (black bars). Levels of mRNA for denoted genes were assessed by Q-PCR. *P < 0.05 RA-treated cells expressing GFP versus RA-treated GFP-KLF2–expressing cells. H: Preadipocytes were infected with retroviruses encoding GFP or GFP-KLF2. ChIP analyses were carried out using KLF2 antibodies. PCR was conducted to amplify the regions containing the KLF response element in the promoters of RARγ and CRABP-II. I: Preadipocytes were infected with a retrovirus encoding GFP or GFP-KLF2 and then treated with RA (0.1 μmol/L, 4 h). Levels of mRNA for Cyp26a1 (white bars), Pref-1 (black bars), and Sox9 (gray bars) were measured by Q-PCR. ##P < 0.001 RA-treated versus nontreated cells; #P ≤ 0.01 cells infected with GFP versus GFP-KLF2–encoding vector; **P < 0.001 RA-treated cells expressing GFP versus RA-treated GFP-KLF2–expressing cells. Data are means ± SD from three separate experiments.
FIG. 5.
FIG. 5.
Decreasing CRABP-II expression exacerbates obesity by promoting adipocyte differentiation in vivo. A: Levels of denoted mRNAs from WAT of WT (white bars) and CRABP−/+ (black bars) mice fed a normal chow diet (n = 3). B: Body weight of 8-week-old WT (black squares) or CRABP-II+/− (gray circles) mice fed an HFHS diet (WT: n = 4; CRABP-II+/−: n = 3). C: Food intake of WT (black squares) or CRABP-II+/− (gray circles) mice fed an HFHS diet, normalized to body weight (WT: n = 4; CRABPII+/−: n = 3). D: Weights of WAT, liver, and skeletal muscle in WT (white bar) and CRABP+/− (gray bar) mice following 14 weeks of HFHS feeding. Hematoxylin-eosin staining of liver (E) and adipose tissue (F) of WT and CRABP-II+/− mice following 14 weeks of HFHS feeding. G: Adipocyte diameters in WT and CRABP-II+/− mice following 14 weeks of HFHS feeding. Total of 50 adipocytes per adipose tissue were measured (n = 3 mice/group). H: Levels of mRNAs for denoted genes in WAT of WT (white bar) and WAT of CRABP-II+/− (black bar) mice following 14 weeks of HFHS feeding (n = 3/group). Data are mean ± SEM. *P < 0.05 WT versus CRABP-II+/− mice. (A high-quality color representation of this figure is available in the online issue.)
FIG. 6.
FIG. 6.
Effect of decreasing CRABP-II expression on adipose genes and blood parameters. A: Levels of denoted mRNAs from WAT of WT (white bars) and CRABP-II+/− (black bars) mice (n = 3/group). Inset: serum levels of leptin in blood of WT and CRABP-II+/− mice following 14 weeks of HFHS feeding (n = 3 to 4/group). Plasma concentrations of cholesterol (B), triglycerides (C), and free fatty acids (D) in WT (white bars) and CRABP-II+/− (black bars) mice (n = 3 to 4/group). Data are means ± SEM. E: A model for RA-induced inhibition of adipogenesis. In preadipocytes, RA activates CRABP-II and RARγ to induce expression of Pref-1, Sox9, and KLF2, which, in turn, potently inhibit adipogenesis. KLF2 upregulates RARγ and CRABP-II, thereby propagating a positive-feedback loop that further potentiates RA induced inhibition of adipocyte differentiation. *P < 0.01; **P = 0.04 WT versus CRABP-II+/− mice.

References

    1. Green H, Kehinde O. An established preadipose cell line and its differentiation in culture. II. Factors affecting the adipose conversion. Cell 1975;5:19–27 - PubMed
    1. Green H, Meuth M. An established pre-adipose cell line and its differentiation in culture. Cell 1974;3:127–133 - PubMed
    1. Tontonoz P, Hu E, Graves RA, Budavari AI, Spiegelman BM. mPPAR gamma 2: tissue-specific regulator of an adipocyte enhancer. Genes Dev 1994;8:1224–1234 - PubMed
    1. Shao D, Lazar MA. Peroxisome proliferator activated receptor gamma, CCAAT/enhancer-binding protein alpha, and cell cycle status regulate the commitment to adipocyte differentiation. J Biol Chem 1997;272:21473–21478 - PubMed
    1. Farmer SR. Transcriptional control of adipocyte formation. Cell Metab 2006;4:263–273 - PMC - PubMed

Publication types

MeSH terms