Comparative Study
. 2012 Feb 15;32(7):2287-98.
doi: 10.1523/JNEUROSCI.4304-11.2012.

Incorporating cross-modal statistics in the development and maintenance of multisensory integration

Affiliations
Comparative Study

Incorporating cross-modal statistics in the development and maintenance of multisensory integration

Jinghong Xu et al. J Neurosci. .

Abstract

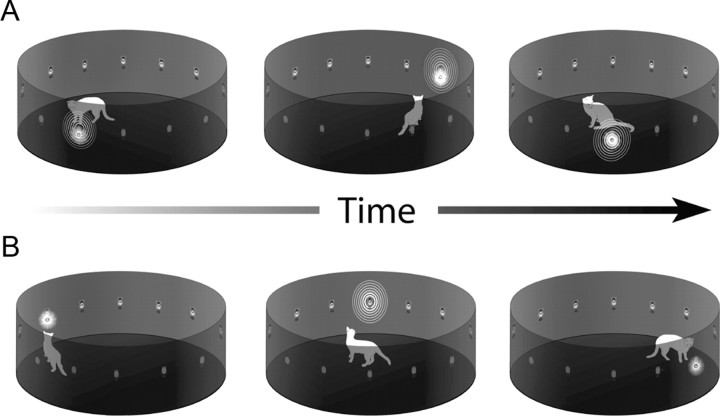
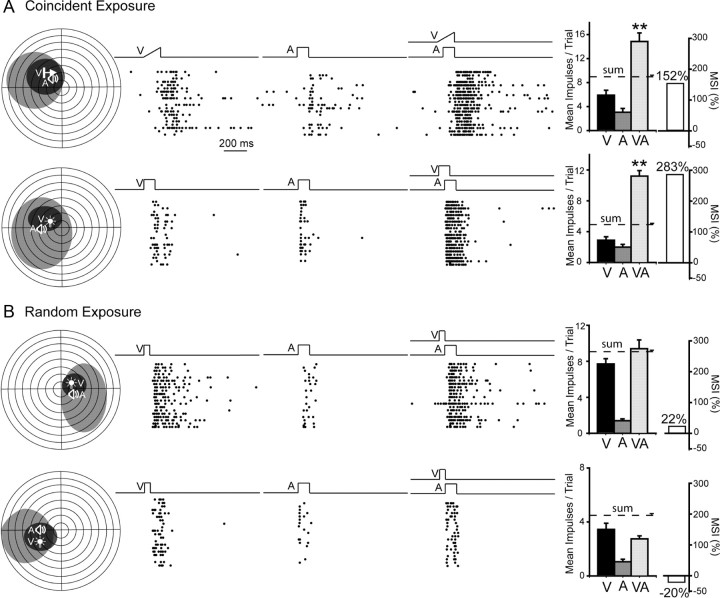
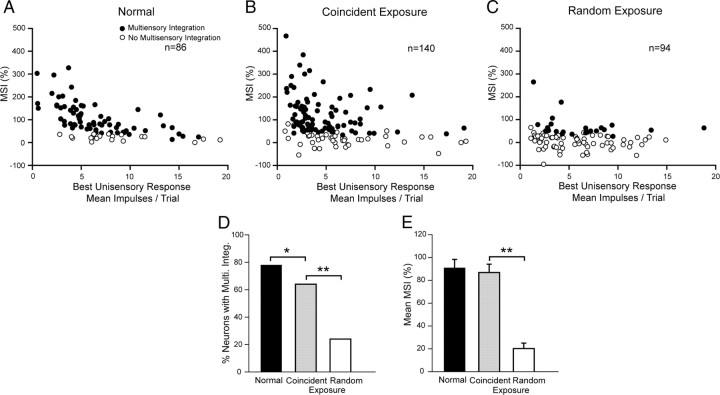
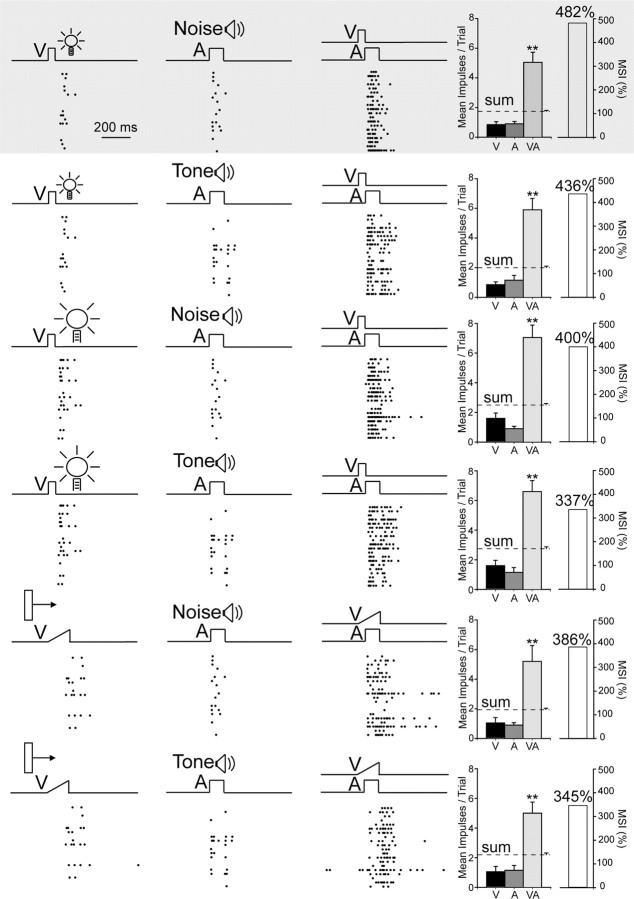
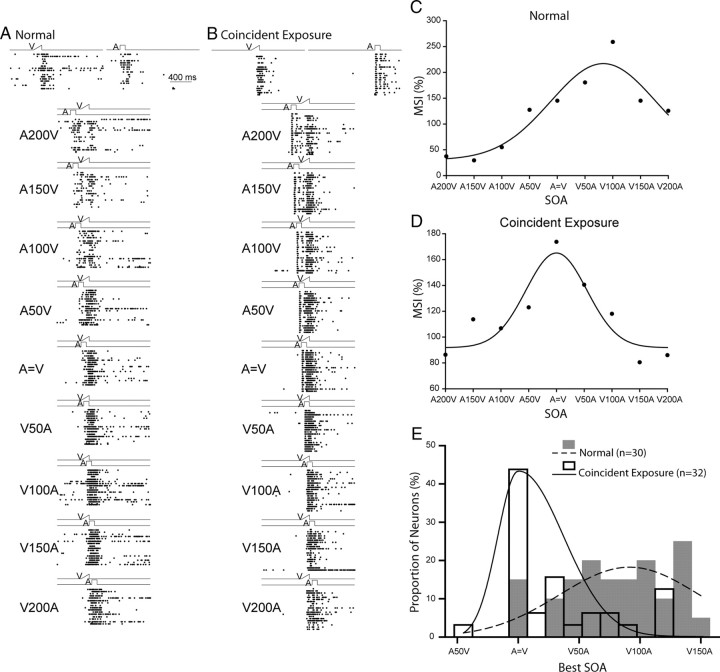
Development of multisensory integration capabilities in superior colliculus (SC) neurons was examined in cats whose visual-auditory experience was restricted to a circumscribed period during early life (postnatal day 30-8 months). Animals were periodically exposed to visual and auditory stimuli appearing either randomly in space and time, or always in spatiotemporal concordance. At all other times animals were maintained in darkness. Physiological testing was initiated at ∼2 years of age. Exposure to random visual and auditory stimuli proved insufficient to spur maturation of the ability to integrate cross-modal stimuli, but exposure to spatiotemporally concordant cross-modal stimuli was highly effective. The multisensory integration capabilities of neurons in the latter group resembled those of normal animals and were retained for >16 months in the absence of subsequent visual-auditory experience. Furthermore, the neurons were capable of integrating stimuli having physical properties differing significantly from those in the exposure set. These observations suggest that acquiring the rudiments of multisensory integration requires little more than exposure to consistent relationships between the modality-specific components of a cross-modal event, and that continued experience with such events is not necessary for their maintenance. Apparently, the statistics of cross-modal experience early in life define the spatial and temporal filters that determine whether the components of cross-modal stimuli are to be integrated or treated as independent events, a crucial developmental process that determines the spatial and temporal rules by which cross-modal stimuli are integrated to enhance both sensory salience and the likelihood of eliciting an SC-mediated motor response.


Figures

Figure 1.
Figure 1.
Four cats were raised from birth in darkness, but were exposed daily to periodic visual and/or auditory stimuli in a cylindrical enclosure using two different stimulus exposure paradigms. The animals were free to move anywhere within the enclosure, and the positions and responses shown are illustrative only. In most cases, animals did not react to the stimuli. A, In the coincident exposure paradigm, two animals were exposed to visual–auditory (cross-modal) stimuli that were in spatiotemporal coincidence, but could occur at any location around the circumference of the enclosure. The stimuli were presented at random intervals between 50 and 4000 ms. B, In the random exposure paradigm, two other animals received visual or auditory (modality-specific) stimuli that were presented randomly in space and time with the same frequency. Both groups received 5 h of exposure/d 5 d/week from postnatal day 30 to 8 months of age. Stimuli consisted of flashes of light from LEDs and broadband noise burst from speakers embedded in the wall of the enclosure. At all other times the animals were maintained in darkness.
Figure 2.
Figure 2.
The development of multisensory integration capabilities was noted after cross-modal exposure, but not after random exposure. A, Coincident exposure produced the normal expression of multisensory integration as revealed by significant multisensory enhancement. Left, Receptive fields are delimited within schematics of visual–auditory space in which each circle represents 10° (black, visual receptive field; gray, auditory receptive field). Icons (V, A) show stimulus locations. Middle, Rasters (ordered bottom-top) illustrate responses to V, A, and V–A stimuli. Right, Summary bar graphs illustrate the mean responses elicited by each stimulus condition, as well as the resultant MSI, a measure of multisensory enhancement. Note that the multisensory response exceeded both unisensory responses and also exceeded their sum, yielding high MSIs (**p < 0.001). B, Random modality-specific exposure failed to produce multisensory integration capabilities in either of the exemplar neurons illustrated. Note the absence of significant multisensory enhancement in both cases, with MSIs between −20% and +22%. Error bars represent the SEM. Receptive fields are contralateral to the SC of the recorded neurons.
Figure 3.
Figure 3.
The populations of neurons exhibiting multisensory integration following either of two exposure paradigms and normal control. A, MSIs are plotted for multisensory neurons from normally reared control animals. B, A high proportion of neurons in the coincident exposure group exhibited multisensory integration. Although fewer of them developed than in normal animals, their MSIs were within the normal range. C, However, few neurons in the random exposure group developed multisensory integration, and those that did had very low MSIs. These group differences are also evident in the summary bar graphs of D and E, which compare the incidence of multisensory integration and the mean MSI magnitude (black bar, normal; gray bar, coincident; white bar, random). *p < 0.05, **p < 0.001.
Figure 4.
Figure 4.
Neurons that acquired multisensory integration capabilities during the cross-modal exposure period generalized it to configurations that had not been experienced. Shown is an exemplar neuron. Responses to the exposure set are provided in the first row (shaded). The responses to six stimuli sets are displayed here, with each row representing one set. Note changes in the nature of the visual and auditory stimuli as indicated by the icons or labels. In each case, responses to the cross-modal stimuli were far greater than those to either modality-specific component stimuli, even when the test stimuli did not match those presented during the exposure period. All conventions are the same as in Figure 2.
Figure 5.
Figure 5.
Population data revealing that the magnitude of multisensory integration did not differ between exposure and nonexposure stimulus configurations. A, Plotted is the MSI as a function of the best unisensory responses for each of six stimuli sets, respectively, from all sampled neurons. Tests of the exposure configuration are in the top left. Note that most neurons were able to integrate all six stimuli sets. B, The mean MSI of the exposure combination (for the population of neurons studied) was not significantly different from any of the other nonexposure combinations, although there was a stepwise decline in the mean MSI when the cross-modal combination tested was stepped away (see text) from the exposure combination (C). Note that there are also no significant differences in the best unisensory responses among the groups (D).
Figure 6.
Figure 6.
The spatial principle of multisensory integration was acquired despite exposure to only spatially concordant cross-modal stimuli. During the cross-modal exposure period the stimuli were always in spatial concordance. However, both multisensory enhancement (to concordant stimuli, A1), and multisensory depression (to discordant stimuli, A2) capabilities developed in this exemplar neuron. Conventions are the same as in previous figures.
Figure 7.
Figure 7.
The principle of inverse effectiveness was acquired despite exposure being confined to only one invariant pair of cross-modal stimuli. Shown are the responses of this neuron to three relative intensities (low, medium, high) of modality-specific and cross-modal stimuli. As stimulus effectiveness (i.e., intensity) increased, so did unisensory and multisensory responses. However, the former increased proportionately more than did the latter, thereby decreasing MSI. Conventions are the same as in prior figures.
Figure 8.
Figure 8.
A spatial “proximity effect” was induced by the cross-modal exposure experience. A, This exemplar neuron exhibited significantly greater multisensory responses to “aligned” cross-modal stimuli that matched the exposure configuration (VA1) than to those that were nonaligned (VA2) despite still being within their respective receptive fields. B, Whereas the former configuration produced responses that were larger than the predicted sum of the V and A responses (i.e., superadditive), the latter produced only additive responses. C, This was generally the case in the population of neurons studied. Results from this population are shown by comparing average MSIs in aligned and unaligned conditions. Conventions are the same as in prior figures.
Figure 9.
Figure 9.
A temporal “proximity effect” was induced by the cross-modal exposure experience. A–B, Shown are exemplar neurons from animals in the normal control group and from those in the coincident cross-modal exposure group. At the top are shown rasters of their unisensory visual and auditory responses. Just below are rasters showing their responses to stimuli at different SOAs (stimulus onset asynchronies). C–D, The MSI of each neuron in each group is plotted as a function of SOA, fitted with a Gaussian function. A200 V = A preceding V by 200 ms, and V = A represents simultaneity. Note that the optimal SOA for neurons in normal animals is close to 100 ms, whereas for neurons in the coincident cross-modal exposure group the optimal is near simultaneity. E, The distribution of best SOAs (predicted by the peak positions of the Gaussian fit), bin width = 15 ms. Note that in coincident exposure animals the best SOAs are to the left of those from normal animals. Conventions are the same as in prior figures.

Similar articles

Cited by

References

    1. Alvarado JC, Stanford TR, Vaughan JW, Stein BE. Cortex mediates multisensory but not unisensory integration in superior colliculus. J Neurosci. 2007;27:12775–12786. - PMC - PubMed
    1. Alvarado JC, Rowland BA, Stanford TR, Stein BE. A neural network model of multisensory integration also accounts for unisensory integration in superior colliculus. Brain Res. 2008;1242:13–23. - PMC - PubMed
    1. Bolognini N, Rasi F, Coccia M, Làdavas E. Visual search improvement in hemianopic patients after audio-visual stimulation. Brain. 2005;128:2830–2842. - PubMed
    1. Buonomano DV, Merzenich MM. Cortical plasticity: from synapses to maps. Annu Rev Neurosci. 1998;21:149–186. - PubMed
    1. Feldman DE. A new critical period for sensory map plasticity. Neuron. 2001;31:171–173. - PubMed

Publication types

MeSH terms

LinkOut - more resources