Comparative Study
. 2012 Feb 15;32(7):2357-76.
doi: 10.1523/JNEUROSCI.5243-11.2012.

Mechanisms underlying signal filtering at a multisynapse contact

Affiliations
Comparative Study

Mechanisms underlying signal filtering at a multisynapse contact

Timotheus Budisantoso et al. J Neurosci. .

Abstract

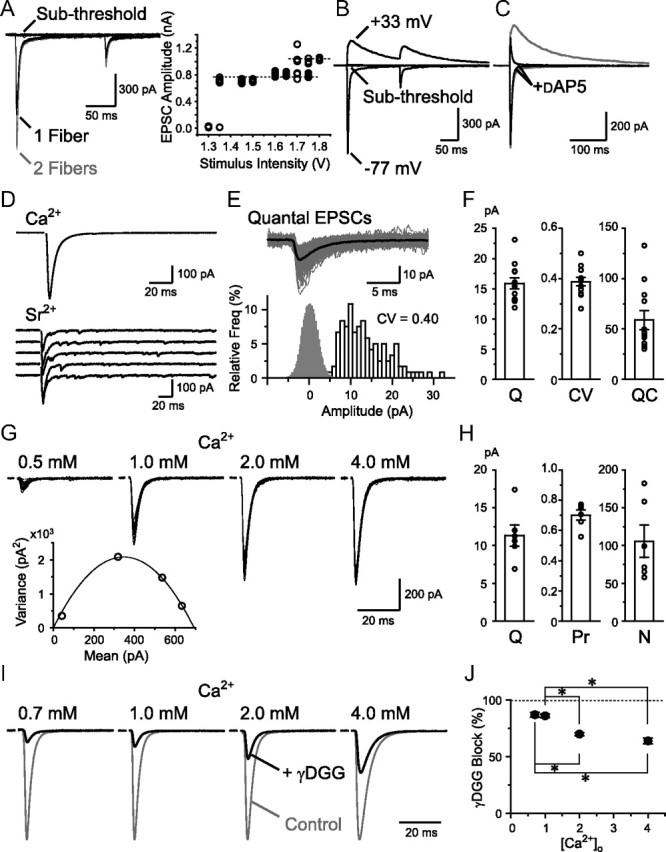
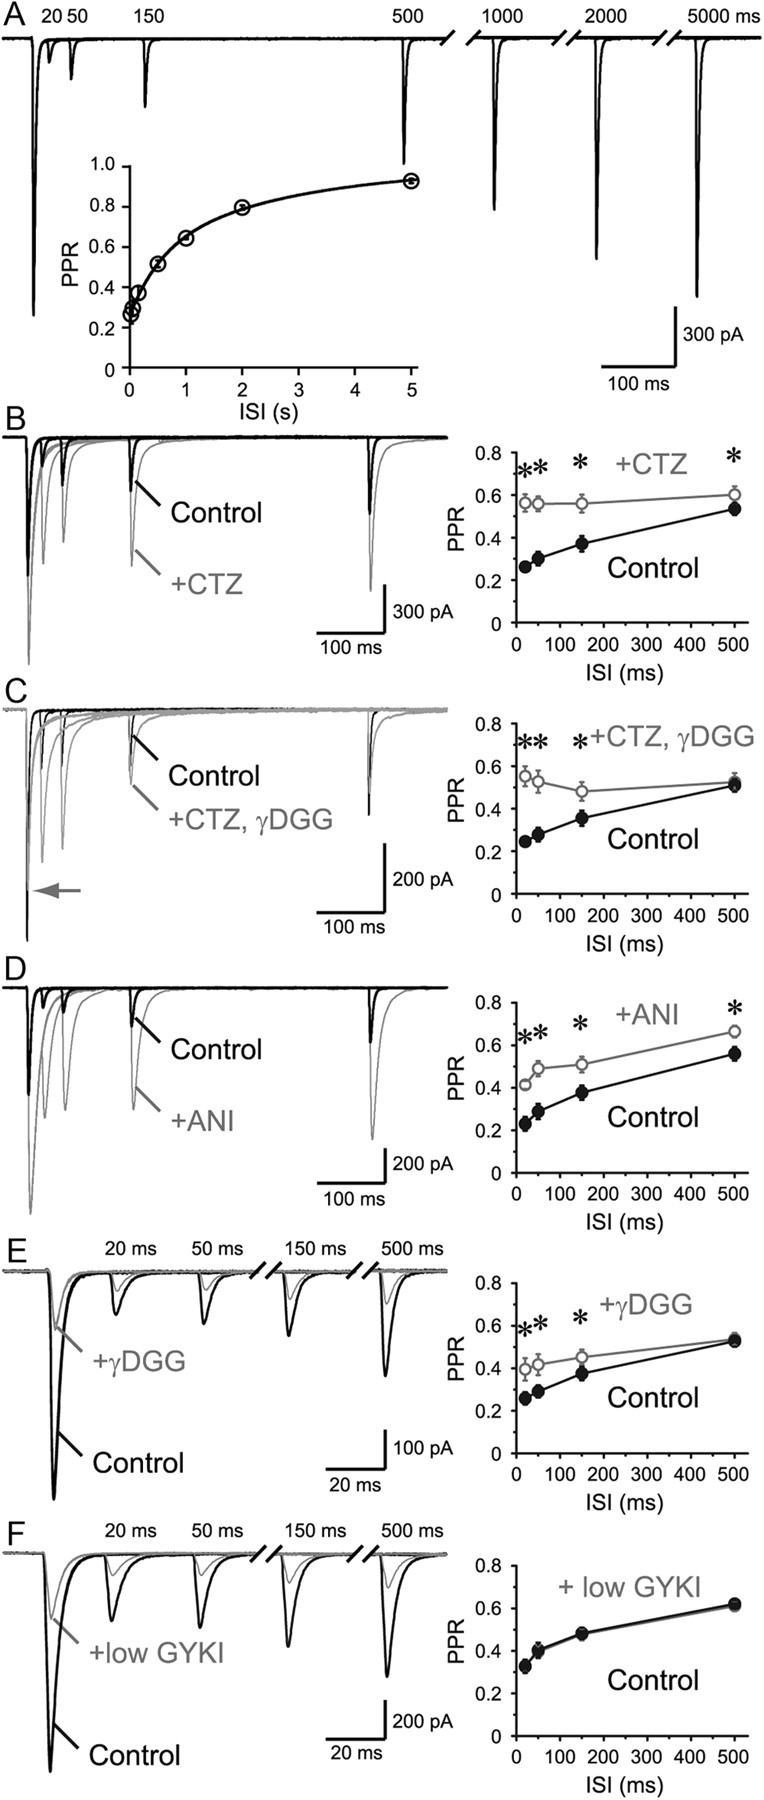
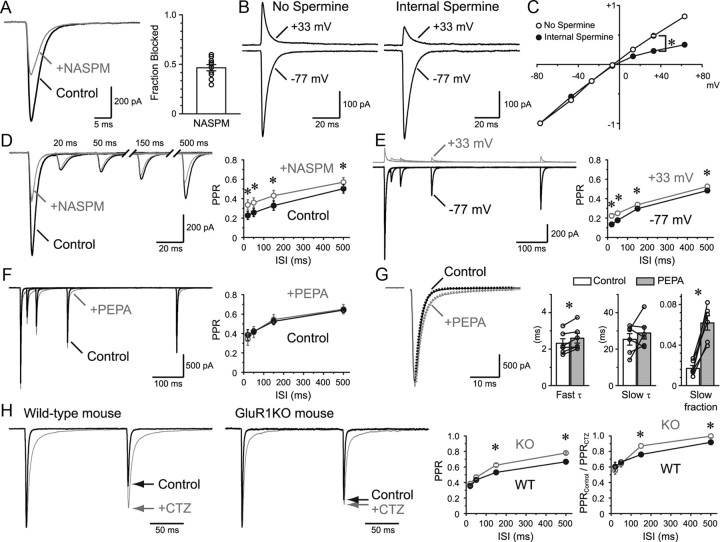
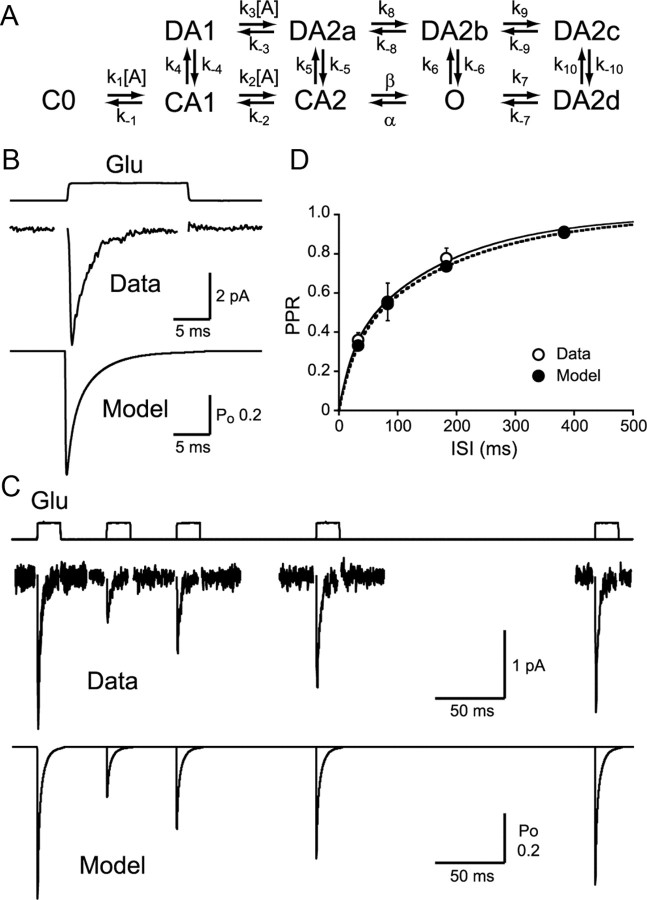
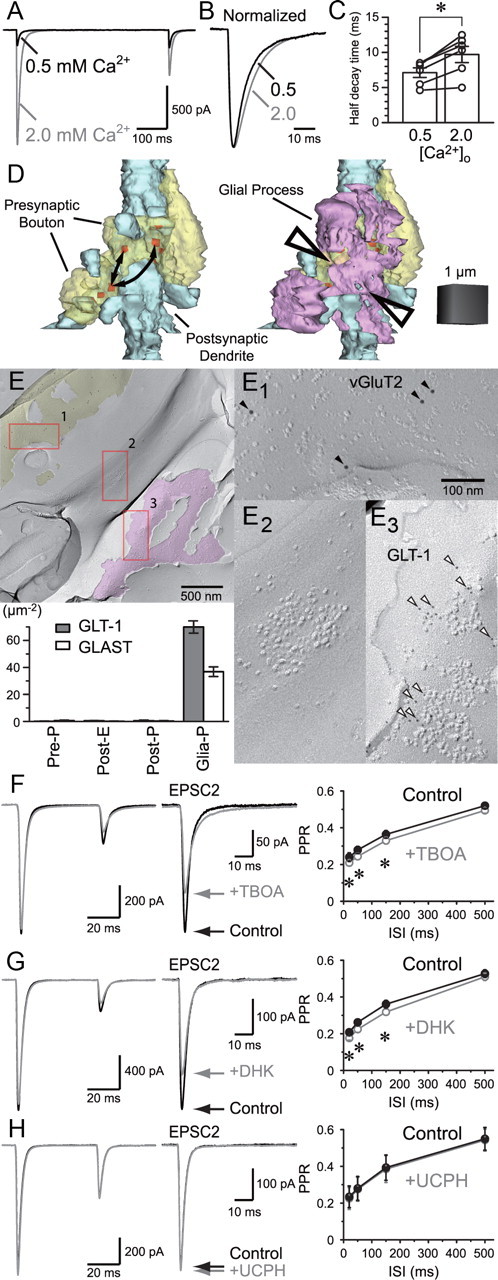
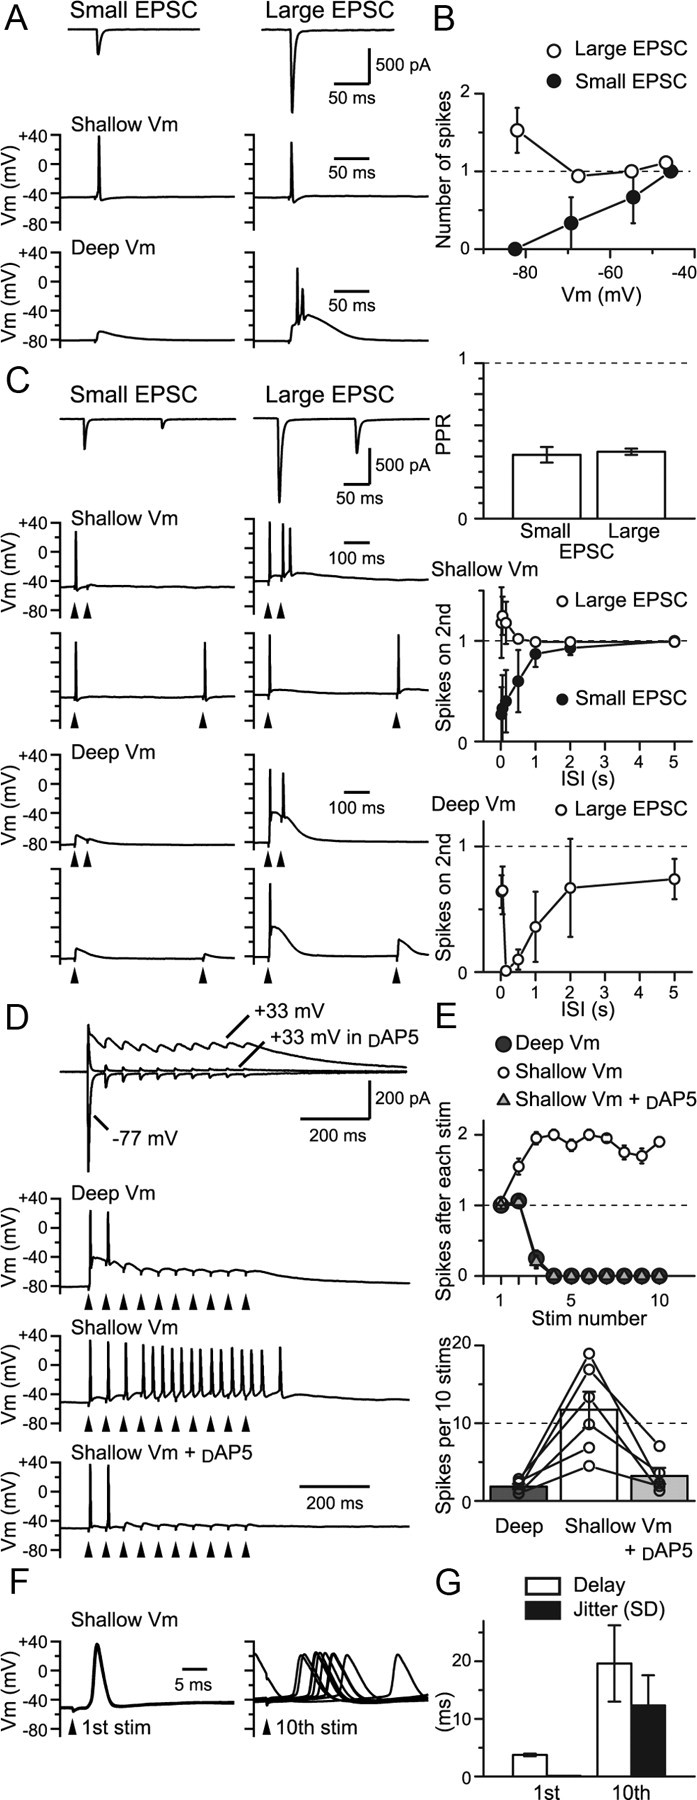
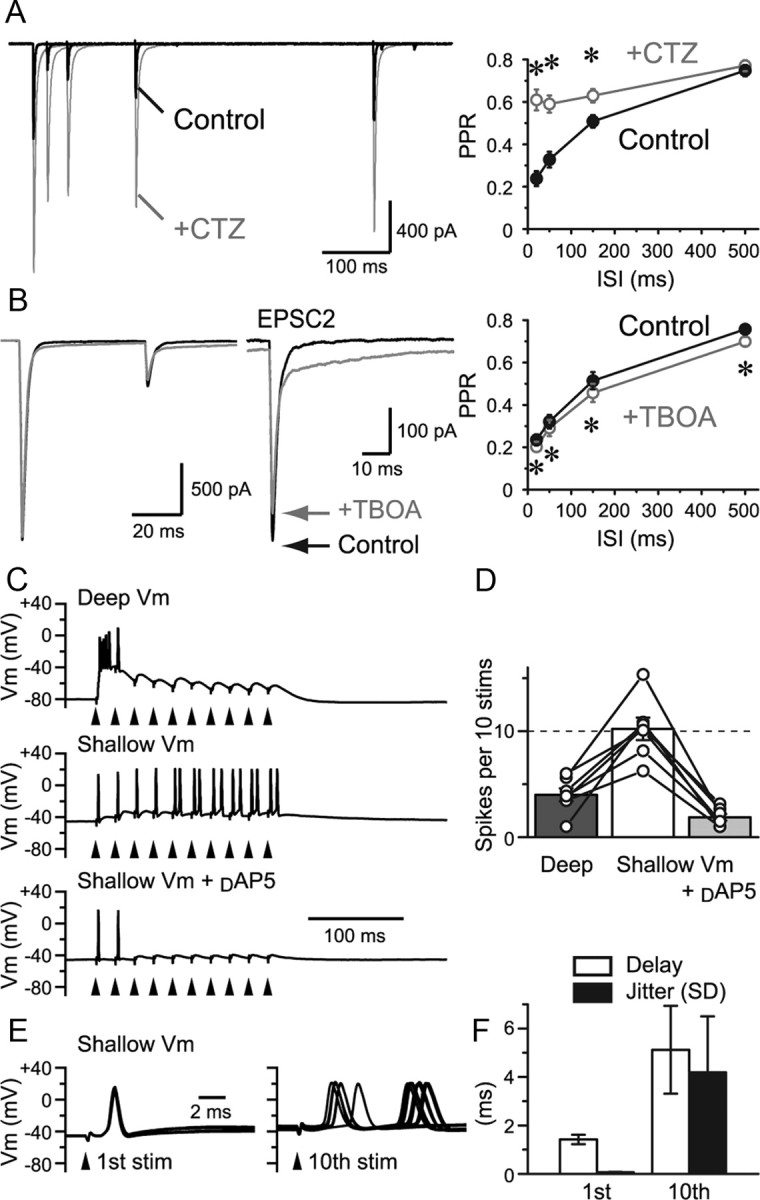
Visual information must be relayed through the lateral geniculate nucleus before it reaches the visual cortex. However, not all spikes created in the retina lead to postsynaptic spikes and properties of the retinogeniculate synapse contribute to this filtering. To understand the mechanisms underlying this filtering process, we conducted electrophysiology to assess the properties of signal transmission in the Long-Evans rat. We also performed SDS-digested freeze-fracture replica labeling to quantify the receptor and transporter distribution, as well as EM reconstruction to describe the 3D structure. To analyze the impact of transmitter diffusion on the activity of the receptors, simulations were integrated. We identified that a large contributor to the filtering is the marked paired-pulse depression at this synapse, which was intensified by the morphological characteristics of the contacts. The broad presynaptic and postsynaptic contact area restricts transmitter diffusion two dimensionally. Additionally, the presence of multiple closely arranged release sites invites intersynaptic spillover, which causes desensitization of AMPA receptors. The presence of AMPA receptors that slowly recover from desensitization along with the high presynaptic release probability and multivesicular release at each synapse also contribute to the depression. These features contrast with many other synapses where spatiotemporal spread of transmitter is limited by rapid transmitter clearance allowing synapses to operate more independently. We propose that the micrometer-order structure can ultimately affect the visual information processing.


Figures

Figure 1.
Figure 1.
Basic properties of RG synaptic transmission. A, RG–RC EPSCs recorded with varying stimulus intensities (10 traces each). EPSC amplitude plotted against the intensity on the right. B, EPSCs were recorded at −77 and +33 mV at subthreshold and overthreshold stimulus intensities. C, AMPAR current dominated at negative potentials and was isolated using d-AP5 in most of all the following experiments. D, EPSCs evoked by single RG fiber stimulation were recorded in the presence of [Ca2+]o. After substitution with [Sr2+]o to desynchronize release, qEPSCs from the stimulated fiber were measured. E, qEPSCs were aligned (gray) and averaged (black). Histograms of qEPSC amplitude and baseline noise (open and gray bars, 1 and 0.2 pA bins, respectively) are shown below. F, Summary of the average qEPSC amplitude (Q), the CV of the amplitude (CV), and the QC (n = 12). G, EPSCs in the presence of various [Ca2+]o (20 traces each are shown). The mean EPSC amplitude was plotted against the variance of the EPSC amplitudes and a parabola function was fitted as below. H, Summary of the estimates of Q, Pr, and N from the mean variance analysis (n = 6). I, Recordings with varying [Ca2+]o from four cells are shown with the EPSC amplitude normalized. Application of 2 mm γDGG produced a different amount of block depending on the Pr. J, Block by γDGG was plotted against the [Ca2+]o (n = 4–7). *p < 0.05. Error bars indicate SEM.
Figure 2.
Figure 2.
Prolonged AMPAR desensitization enhances PPD. A, Paired-pulse stimuli were applied to an RG fiber. PPR recovery time course is shown in inset (double exponential fit: τfast = 561 ms, 43%, τslow = 2713 ms, n = 6). B–F, Initial phase of the recovery was examined. B, Application of AMPAR desensitization blocker, CTZ (100 μm), accelerated the recovery from depression. PPR was plotted against the ISI on the right (n = 9). C, To avoid saturation, γDGG (1–2 mm) was coapplied with CTZ, and acceleration of the recovery was also observed (n = 9). D, Another desensitization blocker, aniracetam (ANI, 4–5 mm), which has been reported to have no presynaptic effects, was applied and the acceleration of the PPR recovery was observed (n = 7). E, Low-affinity antagonist, γDGG (2 mm), would save a subpopulation of AMPARs from entering the desensitized state. As expected, application of γDGG alone also accelerated the PPR recovery time course (n = 10). F, Application of low concentration (8 μm) of GYKI, a noncompetitive AMPAR antagonist, likely keeps a subpopulation unresponsive. As expected, there was no effect of the drug on the PPR recovery time course (n = 8), although the amount of block was comparable to that by γDGG. This result also suggests that the change in the PPR in E is not the result of difference in voltage-clamp errors between first and second EPSCs. *p < 0.05. Error bars indicate SEM.
Figure 3.
Figure 3.
GluR subtypes responsible for the prolonged desensitization. A, Approximately half of the EPSC was blocked by a CP-AMPAR selective blocker, NASPM (50 μm). Summary of the block is shown in the bar graph (n = 10). B, EPSCs were recorded at negative and positive potentials in the absence and presence of internal spermine (100 μm). C, I–V of the EPSC with and without internal spermine. EPSCs were normalized to −1 at Vh = −77 mV (n = 2–15 for each plot). The average is shown for all plots. Statistical significance was examined at +33 mV. D, PPR recovered faster in the presence of NASPM (n = 6). E, PPR recovery in the presence of internal spermine at negative and positive potentials. PPR recovered faster at positive potentials where CP-AMPARs were partially blocked (n = 11). F, PEPA (200 μm), which selectively accelerates the recovery from desensitization in GluR3-flop homomeric channels, had no effect on the PPR recovery (n = 6). G, PEPA affected the EPSC decay time course. The decay was fitted with a double exponential function, and the main effect was found on the slow component fraction. H, PPR recovery was studied in wild-type (WT) and GluR1KO mice (n = 17 and 30, respectively). EPSCs were normalized to the first EPSC. The amount of desensitization was compared by dividing the PPR in control by the PPR in the presence of CTZ (n = 6 and 10 for wild-type and GluR1KO, respectively). *p < 0.05. Error bars indicate SEM.
Figure 4.
Figure 4.
Outside-out patch recordings and AMPAR kinetic model. A, Kinetic scheme of the AMPAR model. Rates were as follows (units are M−1s−1 for k1, k2, and k3, and s−1 for the rest): k1 = 13.66 × 10⁶, k−1 = 2.093 × 10³, k2 = 6.019 × 10⁶, k−2 = 4.719 × 10³, k3 = 13.66 × 10⁶, k−3 = 446.23, β = 17.23 × 10³, α = 3.734 × 10³, k4 = 1.0 × 10³, k−4 = 60, k5 = 1.8 × 10³, k−5 = 4.5, k6 = 12.36, k−6 = 1.5, k7 = 500, k−7 = 590.9, k8 = 40, k−8 = 420.9, k9 = 10.34 × 10³, k−9 = 140, k10 = 233.2, k−10 = 0.3242. B, AMPAR desensitization kinetics were studied using a 17 ms pulse of 10 mm glutamate (n = 13; Data, τfast = 0.79 ± 0.18 ms, τslow = 3.88 ± 0.86 ms, %fast = 45.0 ± 7.1, τweighted = 2.14 ± 0.29 ms; Model, τfast = 0.81 ms, τslow = 3.60 ms, %fast = 42.3, τweighted = 2.39 ms). C, Two pulses of glutamate were applied to outside-out patches separated by different intervals. Simulated responses are shown below. D, Recovery from desensitization was plotted (n = 5–10). Double exponential curve fit to the PPR recovery with rates as follows: Data, τfast = 21.9 ms, τslow = 170.5 ms, %fast = 29.9, τweighted = 126.0 ms; Model, τfast = 27.9 ms, τslow = 194.7 ms, %fast = 32.6, τweighted = 140.4 ms. *p < 0.05. Error bars indicate SEM.
Figure 5.
Figure 5.
AMPAR distribution and simulated quantal response. A, An SDS-FRL image of a postsynaptic E-face of an RC with a characteristic IMP cluster (demarcated with red line) representing glutamatergic postsynaptic membrane specialization labeled for AMPARs (with 5 nm gold particles). B, AMPAR labeling positively correlated with the area of synapses (n = 63 complete synapses). C, The average area of a synapse, and the number and density of the immunoparticles from three animals. D, Intrasynaptic distribution of AMPARs was evaluated by dividing the synapse area into five divisions of equal width using the distance map. An additional division with 30 nm width on the outer rim was also made. E, Particle density in each division was averaged across all synapses. No significant difference between the center divisions was found, and only the most peripheral division and the outer rim had significantly lower density. One-way repeated-measures ANOVA followed by pairwise comparisons were used. Very few particles were found in the extrasynaptic region (1.8 ± 0.4 /μm2). F, Glutamate concentration profile (grayscale) and simulated AMPAR Po (pseudo-color) at 0.09 ms after release at the center of gravity of the synapse. G, Average AMPAR immunoparticle distribution from the center of gravity was tabulated (n = 63 synapses from one animal, 10 nm bins, total particle number in histogram = average particles number per synapse = 22.0). Simulated AMPAR peak Po at each distance from the release site was plotted (red). H, The peak number of open AMPARs expected from the AMPAR distribution and simulations at each distance from the release site. Inset, Summed response of all receptors simulated. I, An example of two neighboring IMP clusters on the postsynaptic E-face, accompanied with presynaptic P-face of an RG fiber identified by vGluT2 labeling (arrowheads, 10 nm gold particles). J, Histogram of NNDs of IMP clusters (50 nm bins, n = 186). Distance versus simulated peak Po is shown in red. K, The calculated glutamate concentration transient, Po, and fraction of receptors that is desensitized at 569 nm from the release site. *p < 0.05. Error bars indicate SEM.
Figure 6.
Figure 6.
Evaluation of the possible NGlu and DGlu combinations and the use of other published models of AMPARs. A, Simulated AMPAR peak Po at each distance from the release site was plotted for various NGlu and DGlu combinations. B, Peak Po value at the release site for each combination tested was shown along with the calculated counter map. C, Peak Po curves shown in A were normalized at their peaks to show the difference in the effective range of glutamate action with different NGlu and DGlu combinations. D, Half-width at half-maximum (HWHM) of the peak Po curve was shown with a counter map. E, Using the average distribution of AMPARs in an RG synapse, as calculated in Figure 5G, the average Po transition time course was calculated. This is essentially the time course of the simulated quantal response. F, The peak of the average Po was plotted with a counter map. NGlu/DGlu combinations of 2000/0.1, 4000/0.3, and 8000/0.76 gave similar numbers for the peak average Po of ∼0.3, which matches the expectation from the experimental results. G, The transition time course of the fraction of desensitized AMPARs at 500 nm from the release site was plotted. H, The fraction of desensitized AMPARs at 500 nm and 50 ms from release was plotted with a counter map. Aforementioned combinations gave similar numbers for the desensitized fraction of ∼0.3–0.4. I, Glutamate transient calculated with NGlu/DGlu combinations of 4000/0.3 was used to drive several published AMPAR models (RH2003G1, GluR1 model from Robert and Howe, 2003; HR1997, Purkinje cell AMPAR model from Häusser and Roth, 1997; BM2011, our dLGN RC AMPAR model). Simulated peak Po at each distance from the release site (left, HWHM for each model was indicated with arrowheads), the average Po transition in a synapse (middle), and the transition of the fraction of the desensitized AMPARs at 500 nm from the release site (right) were plotted.
Figure 7.
Figure 7.
Morphological characteristics of RG multisynapse contact. A, An SDS-FRL image of multiple IMP clusters in close vicinity. B, An example of an EM image of an ultrathin section of the RG–RC contact containing multiple synapses (arrowheads). C, 3D reconstructed representation of a simple type RG–RC contact. Shown are the RC dendrite (blue) with PSD locations (red), and RG terminal (right, yellow) overlaid. D, The number of synapses per contact (n = 7 simple contacts). The surface NND and number of neighboring synapses within 700 and 1400 nm calculated from an example contact shown in C (n = 29 synapses). E, 3D reconstruction of “complex” type RG–RC synaptic contacts. Shown in blue is the RC dendrite, pink and red areas indicate PSDs of synapses formed by axon 1 (light red) and 2 (yellow), respectively. Shown below is the same glomerulus with axon structures overlaid. F, Number of synapses per contact (n = 9 complex contacts), and the surface NND and the number of neighboring synapses within 700 and 1400 nm calculated from an example contact shown in E (axon 1; n = 8 synapses).
Figure 8.
Figure 8.
Simulations evaluating the extent of spillover and its effect on the AMPAR activation. A, Two instances of glutamate release were supposed with various time intervals (Δt) in an average synapse with AMPAR distribution calculated in Figure 5G. B, An ellipse was fitted to the demarcation of an example synapse shown in Figure 5A, and displaced (Δd) glutamate release was supposed. C, A prepulse of glutamate in the center and a test pulse in the displaced location of varying distances. D, Two synapses with average AMPAR distribution were supposed with the intersynaptic distance (Δd) and interval (Δt) between the two releases varied. History of release at the neighboring synapse reduced the average Po in response to a subsequent direct release. The sum of the response from the two synapses was calculated, and the PPR was plotted against varying Δt and Δd. E, Multiple synapses with average AMPAR distribution were placed in a realistic manner. From the center synapse, one neighbor was placed at 700 nm distance, and five neighbors within 1400 nm. Two instances of UVRs separated by Δt = 50 ms were supposed at the specified synapses. Average Po of AMPARs in all six synapses was calculated. The average Po to the second instance of release was reduced compared with the case where all synapses operated independently without intersynaptic spillover. F, MVR was considered in a subset of synapses. The average Po in response to the second instance of release was further reduced.
Figure 9.
Figure 9.
Experimental support for the presence of intersynaptic spillover. A, EPSCs were recorded in 0.5 and 2.0 mm [Ca2+]o in the presence of aniracetam. B, EPSCs were normalized to the peak amplitude. C, Half decay time was significantly different supporting the presence of spillover at 2.0 mm [Ca2+]o. D, 3D reconstruction of an RG–RC contact with two boutons from the same presynaptic fiber contacting in close vicinity. Arrows indicate possible routes of interbouton spillover. Glial cell processes (magenta) occupy the space between the boutons, likely preventing interbouton spillover (arrowheads). E, Replica of RG–RC contact area. Shown in yellow is the P-face fracture with vGluT2 labeling (E1, 10 nm, filled arrowheads) indicating that this plane is of an RG terminal. E2 shows the presence of a typical IMP cluster on E-face of an RC dendrite. Magenta highlights a P-face of glial cell membrane where GLT-1 labeling (E3, 5 nm, open arrowheads) was detected. Significant labeling of either GLT-1 or GLAST was found only on glial cell P-face as indicated in the bar graph. F, Paired-pulse EPSC in the absence and presence of TBOA (30 μm). The second EPSC is enlarged and shown on the right. The second EPSC was reduced by TBOA likely due to the enhanced spillover, which further promoted AMPAR desensitization. G, A similar effect was observed with the GLT-1-specific antagonist DHK (300 μm). H, GLAST-specific antagonist UCPH-101 (100 μm) had no effect. *p < 0.05. Error bars indicate SEM.
Figure 10.
Figure 10.
Physiological impact of short-term synaptic plasticity. A, RG–RC EPSCs and spiking responses recorded from the same cells in the absence of d-AP5. Small and large EPSCs were <500 and >500 pA, respectively. Small-EPSC fiber could produce an action potential response only when the resting potential was made shallow. Large EPSC fiber evoked an action potential response regardless of the resting potential. B, Number of spikes produced plotted against the mean resting potential for small and large EPSCs (n = 3 and 9–14 for small and large EPSCs, respectively). C, PPR of the small and large EPSCs was similar. At shallow potential, spiking often failed upon the second stimulus at short ISIs for the small EPSC fiber, but succeeded for the large EPSC fiber. Spiking at deep resting potential showed a biphasic recovery. D, Trains of stimuli were given at 20 Hz for 10 times. AMPAR EPSC depressed during the train, but NMDAR EPSC summated. Train stimulation failed to evoke more than a few spikes at deep potentials. However, at shallow potentials, multiple spikes were observed. The latter spikes were lost by d-AP5. E, The number of spikes produced within 50 ms after each stimulus during the train for the recording shown in D (20 sweeps). The total number of spikes produced by the train of 10 stimuli is summarized below (n = 6 cells). F, Spike onset after the first and 10th stimulus (10 sweeps). G, The delay to the spike onset and the jitter (SD) of the delay are shown as bar graphs. Stim, Stimulation; Vm, potential. *p < 0.05. Error bars indicate SEM.
Figure 11.
Figure 11.
Experiments done at physiological temperature. A, Paired-pulse stimulation of an RG fiber was applied at various intervals, and EPSCs were recorded at PT of 31–34°C. EPSCs recovered faster than at room temperature. However, application of CTZ still caused a significant difference in the PPR at ISIs of up to 150 ms. This shows that prolonged AMPAR desensitization is also apparent at increased temperature. B, The effect of glutamate transporter blockade by TBOA was examined at PT. PPR was depressed further by TBOA, confirming that glutamate uptake has a small but significant effect of preventing spillover. C, Current-clamp recordings of the spiking responses of an RC in response to a train stimulation (50 Hz) given to an RG fiber at PT. At deep potentials, the cell responded with a burst at the onset of the train stimulus. However, continuing stimuli failed to produce spikes. At shallow resting potential, the cell responded well to the train stimulus. However, the timing and number of the latter spikes were unreliable. Application of d-AP5 diminished the latter spikes, indicating that those spikes were created by the slow and accumulating activation of NMDARs. D, The total number of spikes produced by the 10 stimuli is summarized (n = 7 cells). E, Timing of spike onset after the first and 10th stimulus is shown (10 sweeps). F, The delay of the onset of spike after the stimulus and the jitter (SD) of the delay are shown as bar graphs. stim, Stimulation; Vm, potential. *p < 0.05. Error bars indicate SEM.

References

    1. Antal M, Acuna-Goycolea C, Pressler RT, Blitz DM, Regehr WG. Cholinergic activation of M2 receptors leads to context-dependent modulation of feedforward inhibition in the visual thalamus. PLoS Biol. 2010;8:e1000348. - PMC - PubMed
    1. Bagnall MW, Hull C, Bushong EA, Ellisman MH, Scanziani M. Multiple clusters of release sites formed by individual thalamic afferents onto cortical interneurons ensure reliable transmission. Neuron. 2011;71:180–194. - PMC - PubMed
    1. Barbour B. An evaluation of synapse independence. J Neurosci. 2001;21:7969–7984. - PMC - PubMed
    1. Bergles DE, Dzubay JA, Jahr CE. Glutamate transporter currents in bergmann glial cells follow the time course of extrasynaptic glutamate. Proc Natl Acad Sci U S A. 1997;94:14821–14825. - PMC - PubMed
    1. Blitz DM, Regehr WG. Retinogeniculate synaptic properties controlling spike number and timing in relay neurons. J Neurophysiol. 2003;90:2438–2450. - PubMed

Publication types

Substances

LinkOut - more resources