Comparative Study
. 2012 Feb 15;32(7):2473-84.
doi: 10.1523/JNEUROSCI.4830-11.2012.

Temporal convergence of dynamic cell assemblies in the striato-pallidal network

Affiliations
Comparative Study

Temporal convergence of dynamic cell assemblies in the striato-pallidal network

Avital Adler et al. J Neurosci. .

Abstract

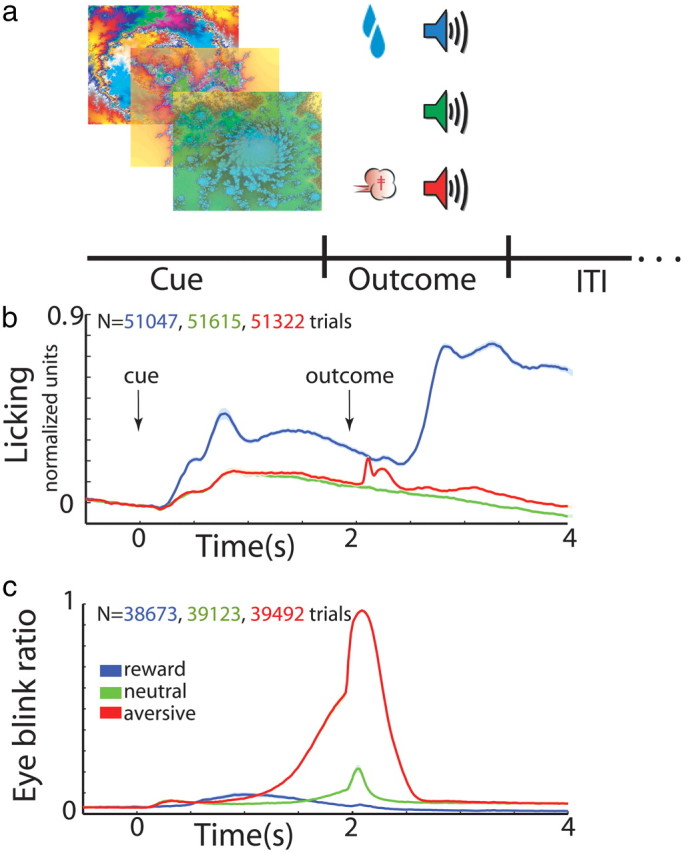
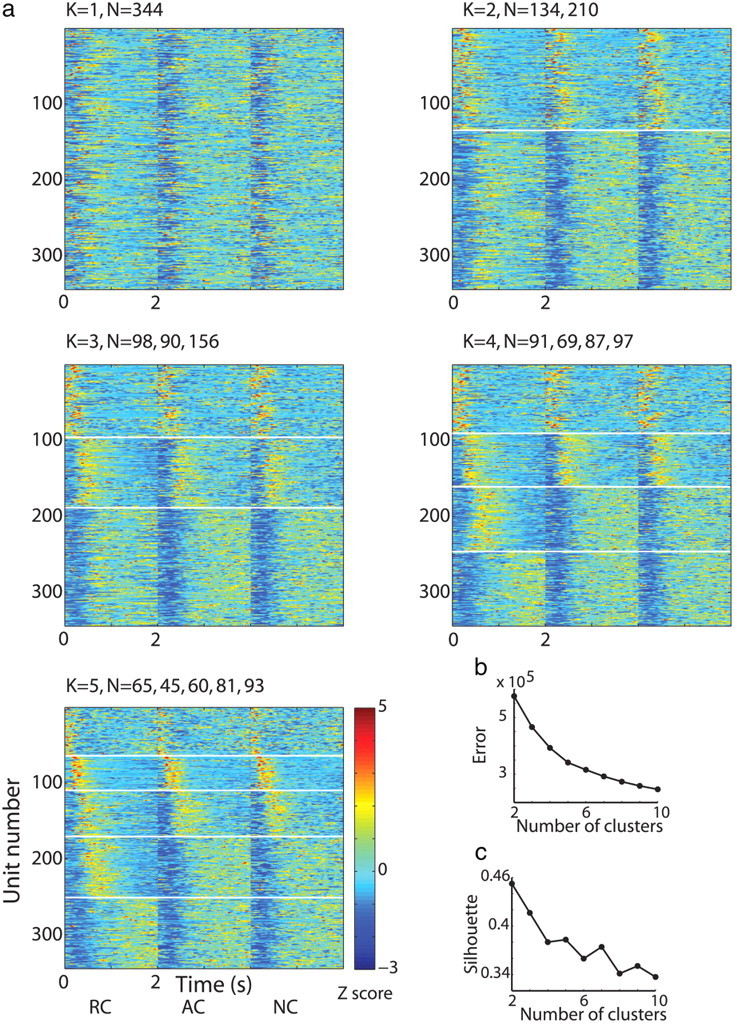
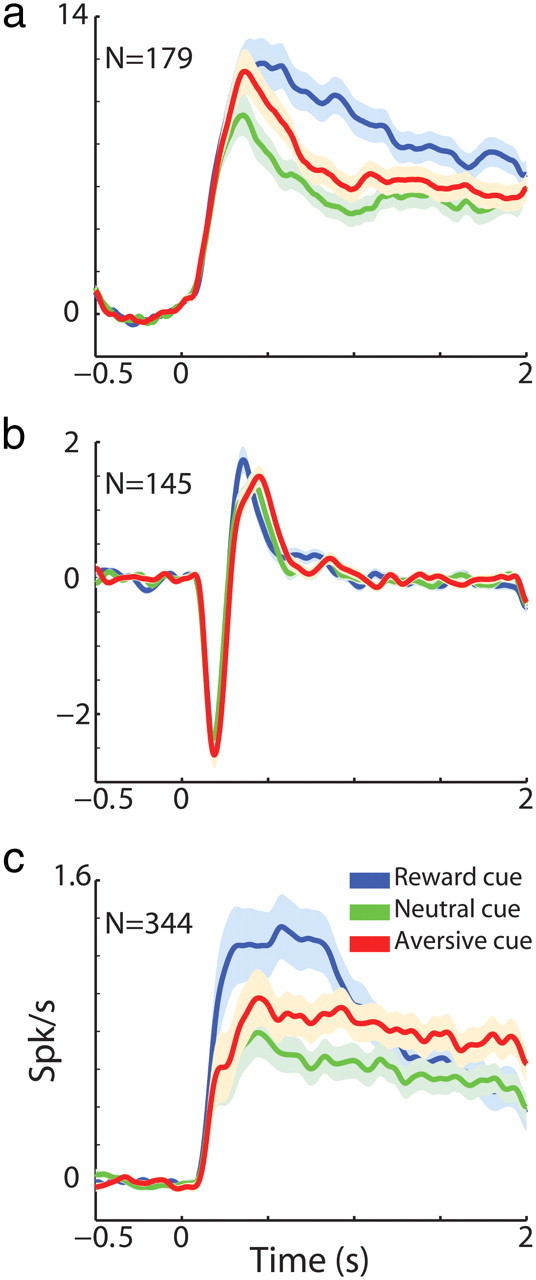
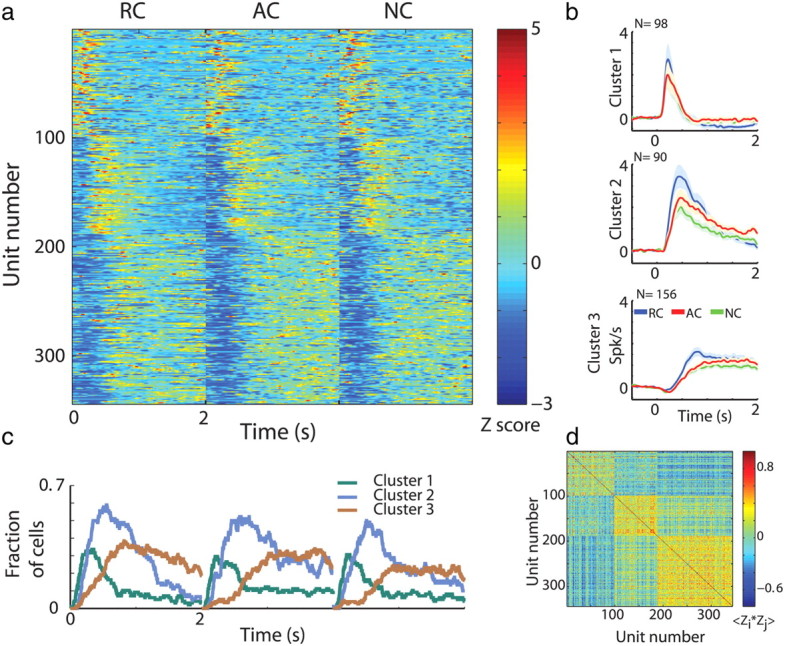
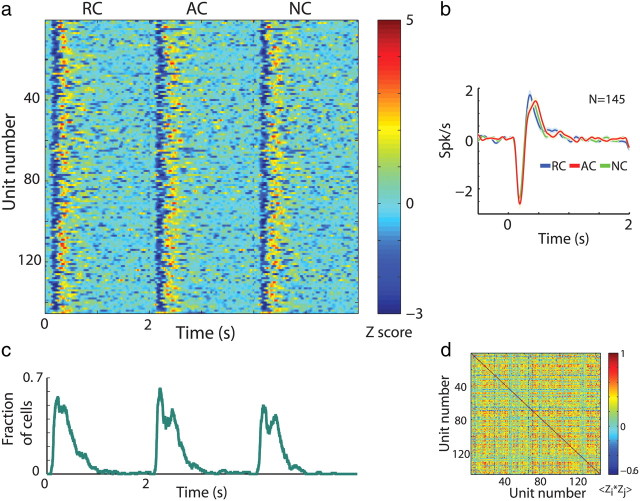
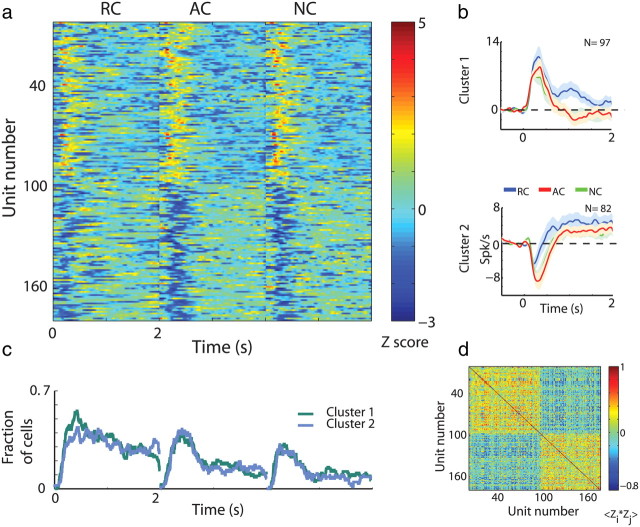
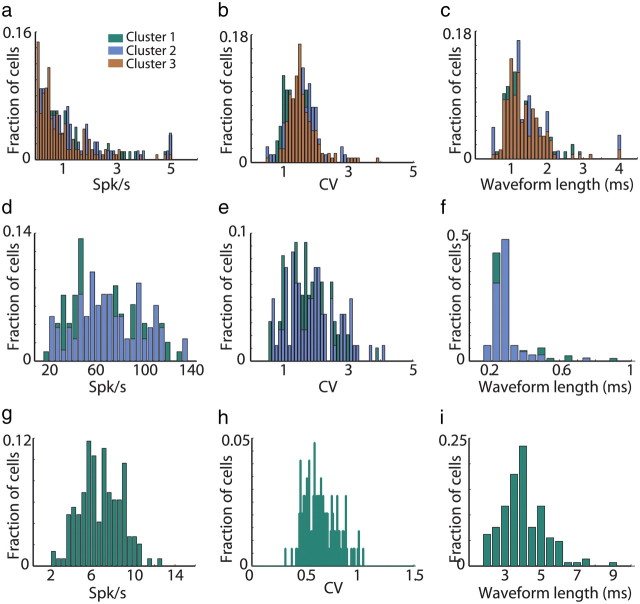
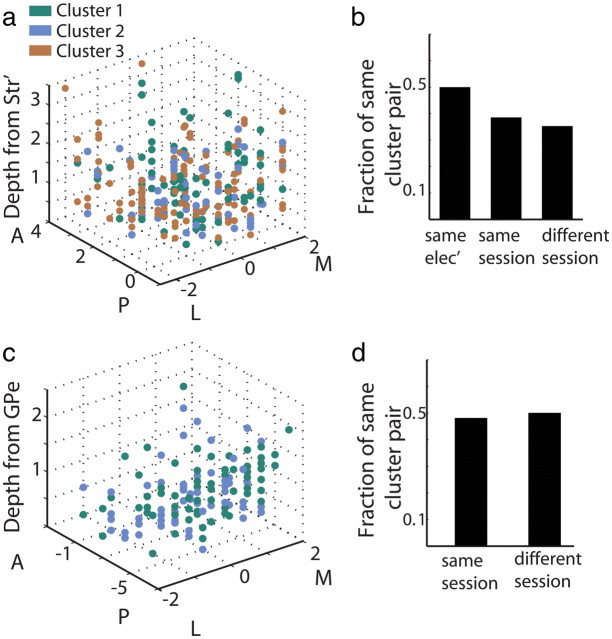
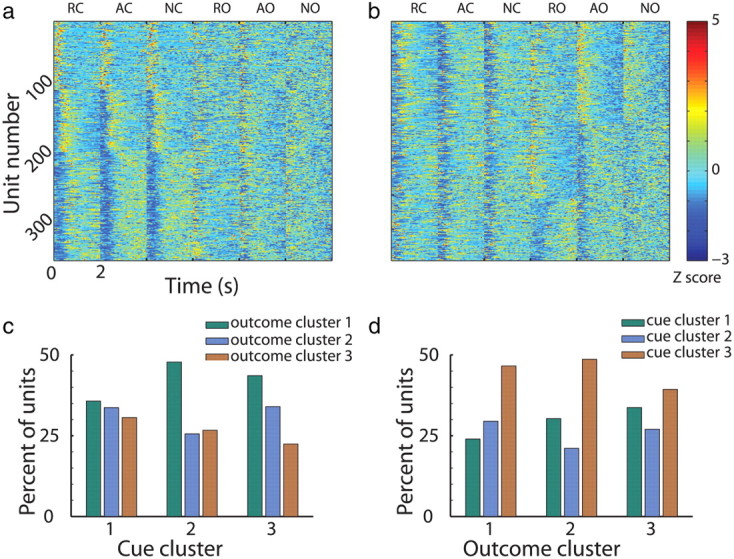
The basal ganglia (BG) have been hypothesized to implement a reinforcement learning algorithm. However, it is not clear how information is processed along this network, thus enabling it to perform its functional role. Here we present three different encoding schemes of visual cues associated with rewarding, neutral, and aversive outcomes by BG neuronal populations. We studied the response profile and dynamical behavior of two populations of projection neurons [striatal medium spiny neurons (MSNs), and neurons in the external segment of the globus pallidus (GPe)], and one neuromodulator group [striatal tonically active neurons (TANs)] from behaving monkeys. MSNs and GPe neurons displayed sustained average activity to cue presentation. The population average response of MSNs was composed of three distinct response groups that were temporally differentiated and fired in serial episodes along the trial. In the GPe, the average sustained response was composed of two response groups that were primarily differentiated by their immediate change in firing rate direction. However, unlike MSNs, neurons in both GPe response groups displayed prolonged and temporally overlapping persistent activity. The putamen TANs stereotyped response was characterized by a single transient response group. Finally, the MSN and GPe response groups reorganized at the outcome epoch, as different task events were reflected in different response groups. Our results strengthen the functional separation between BG neuromodulators and main axis neurons. Furthermore, they reveal dynamically changing cell assemblies in the striatal network of behaving primates. Finally, they support the functional convergence of the MSN response groups onto GPe cells.


Figures

Figure 1.
Figure 1.
Behavioral task. a, Classical conditioning paradigm. Visual cues were presented for 2 s and predicted the delivery of food (reward trials, upper row), air puff (aversive trials, third row), or only sound (neutral trials, second row). The trial outcome epoch was followed by a variable ITI of 5–6 s. b, Normalized licking behavior (average ± SEM, solid line and shaded envelope, respectively) as recorded by an infrared reflection detector directed at the monkeys' mouths. Time 0, cue presentation followed by outcome delivery at time 2 s; blue, reward trials; green, neutral; red, aversive trials; N, number of trials. c, Blinking behavior (average ± SEM) as processed by the video signal, detecting within each recording frame the state of the monkeys' eyes (open, 0; closed, 1). In each time bin (20 ms) we calculated the fraction of trials with eyes closed. Same conventions as in b.
Figure 2.
Figure 2.
Methodology of clustering analysis: K means. a, MSN responses to task cue events. In each subplot, each row is the color coded Z-PSTH of a single MSN to the presentation of the rewarding cues (first column, time 0–2 s) followed by Z-PSTH to the presentation of the aversive cues (second column) and to the neutral cues (third column). N = 344 neurons. Each subplot presents grouping of the Z-PSTHs into different numbers of clusters (K = 1–5) delineated by a white horizontal line. Visual inspection of the cells' responses falling into different numbers of clusters served as one of our criteria for choosing K. b, Error as a function of K (number of clusters) when clustering was performed based on all cue events. Error was defined as the within-cluster sums of distances of data points to centroid summed over all Ks. c, Silhouette (degree of similarity of each point to points in its own cluster compared with points in other clusters) as a function of K (number of clusters).
Figure 3.
Figure 3.
Putamen TANs average transient response versus putamen MSN and GPe average sustained response. a, GPe cell population average response (±SEM) to behavioral cues presented at time 0. The PSTHs were calculated in 1 ms bins and smoothed with a Gaussian window with SD of 20 ms. The baseline firing rate, calculated by averaging the firing rate in the last 0.5 s of the ITI, was subtracted from the smoothed PSTH. For the GPe population, we averaged over the absolute value of the PSTHs. Abscissa, time in seconds; ordinate, firing rate in Hz. Blue, responses to all reward cues; green, responses to all neutral cues; red, responses to all aversive cues. N = 179 neurons. b, TAN population average response (±SEM) to behavioral cues presented at time 0. Same conventions as in a. N = 145 neurons. c, MSN population average response (±SEM) to behavioral cues presented at time 0. Same conventions as in a. N = 344 neurons.
Figure 4.
Figure 4.
Average persistent response of putamen MSNs consists of three cell assemblies firing sequentially along the trial cue epoch. a, MSN responses to task cue events. Each row is the Z-PSTH of a single cell to the presentation of the rewarding cues (RC, time 0–2 s) followed by Z-PSTH to the presentation of the aversive cues (AC) and to the neutral cues (NC). Cells are ordered according to the clustering analysis. Within each cluster cells are randomly ordered. N = 344 neurons. Blue negative Z-scores do not always imply suppression of discharge rates below the baseline discharge. b, Population average responses (±SEM) to cue presentation (time 0) divided into clusters. Abscissa, time in seconds; ordinate, firing rate in Hz normalized by the ITI discharge rate. Blue RC, reward cues; red AC, aversive cues; green NC, neutral cues. c, Fraction of MSNs with a significant response (both increases and decreases in firing rate) to task cue events. Green, MSNs that were classified in the first cluster; cyan, MSNs that were classified in the second cluster; brown, MSNs that were classified in the third cluster. d, Correlation coefficient of the Z-PSTH matrix in a. Each dot is the correlation coefficient between a pair of cells. Hot colors, positive correlation; cold colors, negative correlation.
Figure 5.
Figure 5.
TANs display homogeneous responses to cue presentation. a, TAN responses to task cue events. Same conventions as in Figure 4a. N = 145 neurons. Cells are randomly ordered. b, Population average responses (±SEM) to cue presentation (time 0). Same conventions as in Figure 4b. c, Fraction of TANs with a significant response (both increases and decreases in firing rate) to task cue events. Same conventions as in Figure 4c. d, Correlation coefficient of the Z-PSTH matrix in a. Same conventions as in Figure 4d.
Figure 6.
Figure 6.
Average persistent response of GPe cells is composed of persistent response at the single cell level. a, GPe cell responses to task cue events. Cells are ordered according to the clustering analysis. Within each cluster cells are randomly ordered. Same conventions as in Figure 4a. N = 179 neurons. b, Population average responses (±SEM) to cue presentation (time 0) divided into clusters. Same conventions as in Figure 4b. c, Fraction of GPe neurons with a significant response (both increases and decreases in firing rate) to task cue events. Same conventions as in Figure 4c. d, Correlation coefficient of the Z-PSTH matrix in a. Same conventions as in Figure 4d.
Figure 7.
Figure 7.
Clusters are not differentiated by the spiking parameters of the BG neurons. a, Distribution of MSN firing rates. Abscissa, firing rate in Hz; ordinate: fraction of cells. Green, MSNs classified in the first cluster; cyan, MSNs classified in the second cluster; brown, MSNs classified in the third cluster. b, Distribution of MSNs coefficient of variation of the ISIs. Abscissa, coefficient of variation (CV); ordinate, fraction of cells. Same color code as in a. c, Distribution of MSN waveform length. Abscissa, spike waveform length calculated as the duration from the first negative peak to the next positive peak; ordinate, fraction of cells. Same color code as in a. df, Same as ac for GPe cells. gi, Same as ac for TANs.
Figure 8.
Figure 8.
Clusters are not differentiated by the spatial layout of MSNs and GPe neurons. a, Spatial layout of MSN clusters. Each point represents a MSN. Abscissa: coordinates in the horizontal plane (in mm); M, medial; L, lateral; zero in the center of the putamen in our recordings. Ordinate: coordinates in perisagital plane (in mm); A, anterior; P, posterior; zero is coronal section AC0 (AC, anterior commissure) according to the fusion of the MRI and the primate stereotaxic atlas. z-axis: depth from entry to the putamen (in mm). Cells are color coded according to their clusters. Green, MSNs classified in the first cluster; cyan, MSNs classified in the second cluster; brown, MSNs classified in the third cluster in the cue presentation epoch. b, Fraction of pairs of MSNs belonging to the same cluster. “Same elec',” cell pairs recorded simultaneously from the same electrode; “same session,” cell pairs recorded simultaneously from different electrodes; “different session,” cell pairs recorded in different sessions. c, Spatial layout of GPe clusters. Same as in a for the GPe neurons. d, Fraction of pairs of GPe cells belonging to the same cluster. Same as in b for the GPe neurons. In the pallidal recordings there were only two pairs recorded on the same electrode (left bar in b for MSN pairs), thus, data not shown.
Figure 9.
Figure 9.
The formation of MSN clusters is dynamic. a, Single MSN responses to task events. Same as Figure 4a, however for each cell (row) all six task events are presented. RC, reward cue; AC, aversive cue; NC, neutral cue; RO, reward outcome; AO, aversive outcome; NO, neutral outcome. b, Same as in a, however clustering analysis was run on the outcome events. c, d, Cells are clustered differently in cue versus outcome events. Each group of three bars (green, cyan, and brown) represents the MSNs in every cluster in the outcome (c) or the cue (d) events. The separate bars represent distribution of the cells among the clusters in the cue (c) or the outcome (d) events. There is no pattern in the distribution within each cue or outcome cluster; i.e., the formation of clusters changes along the trial.

References

    1. Alexander GE, DeLong MR. Microstimulation of the primate neostriatum. I. Physiological properties of striatal microexcitable zones. J Neurophysiol. 1985;53:1401–1416. - PubMed
    1. Apicella P, Ljungberg T, Scarnati E, Schultz W. Responses to reward in monkey dorsal and ventral striatum. Exp Brain Res. 1991;85:491–500. - PubMed
    1. Arkadir D, Morris G, Vaadia E, Bergman H. Independent coding of movement direction and reward prediction by single pallidal neurons. J Neurosci. 2004;24:10047–10056. - PMC - PubMed
    1. Bagetta V, Picconi B, Marinucci S, Sgobio C, Pendolino V, Ghiglieri V, Fusco FR, Giampà C, Calabresi P. Dopamine-dependent long-term depression is expressed in striatal spiny neurons of both direct and indirect pathways: implications for Parkinson's disease. J Neurosci. 2011;31:12513–12522. - PMC - PubMed
    1. Bar-Gad I, Morris G, Bergman H. Information processing, dimensionality reduction and reinforcement learning in the basal ganglia. Prog Neurobiol. 2003;71:439–473. - PubMed

Publication types