. 2012 Mar 20;109(12):4574-9.
doi: 10.1073/pnas.1118892109. Epub 2012 Mar 6.

Genetic dating indicates that the Asian-Papuan admixture through Eastern Indonesia corresponds to the Austronesian expansion

Collaborators, Affiliations

Genetic dating indicates that the Asian-Papuan admixture through Eastern Indonesia corresponds to the Austronesian expansion

Shuhua Xu et al. Proc Natl Acad Sci U S A. .

Abstract

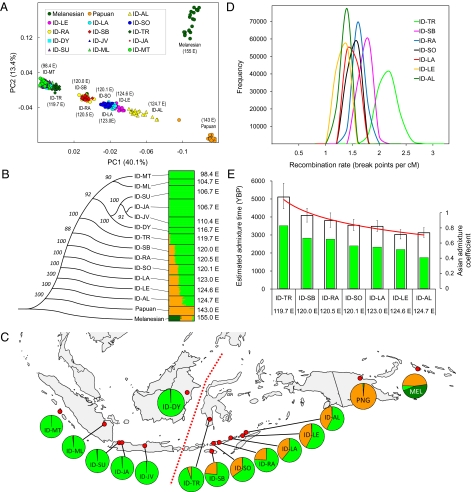
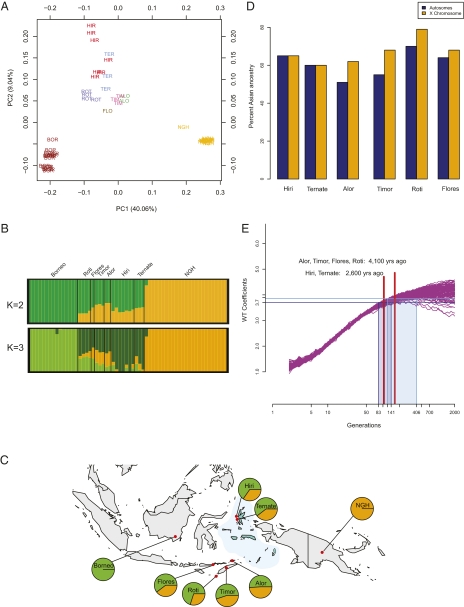
Although the Austronesian expansion had a major impact on the languages of Island Southeast Asia, controversy still exists over the genetic impact of this expansion. The coexistence of both Asian and Papuan genetic ancestry in Eastern Indonesia provides a unique opportunity to address this issue. Here, we estimate recombination breakpoints in admixed genomes based on genome-wide SNP data and date the genetic admixture between populations of Asian vs. Papuan ancestry in Eastern Indonesia. Analyses of two genome-wide datasets indicate an eastward progression of the Asian admixture signal in Eastern Indonesia beginning about 4,000-3,000 y ago, which is in excellent agreement with inferences based on Austronesian languages. The average rate of spread of Asian genes in Eastern Indonesia was about 0.9 km/y. Our results indicate that the Austronesian expansion had a strong genetic as well as linguistic impact on Island Southeast Asia, and they significantly advance our understanding of the biological origins of human populations in the Asia-Pacific region.


Conflict of interest statement

The authors declare no conflict of interest.

Figures

Fig. 1.
Fig. 1.
Analyses of the Pan-Asian SNP dataset. (A) PCA of individuals representing 15 populations. A plot for the first two principle components is shown. Individuals are shaded by different colors according to their population affiliation. Numbers in parentheses indicate the longitude of each population sample. (B) Phylogenetic analysis of 15 populations and estimated population structure. (Left) An unrooted phylogenetic tree shows genetic relationship of the 15 populations using the neighbor-joining method on pairwise FST matrices. Bootstrap values based on 1,000 replicates are also shown. (Right) A plot shows the estimated population structure, with each colored horizontal line representing an individual assigned proportionally to one of the K = 3 clusters with the proportions represented by the relative lengths of the three different colors. Black lines separate individuals from different populations. Populations are labeled on the left by lines connecting to the nodes of the tree. The longitude of each population sample is displayed on the right of the figure. The results shown were based on the highest probability run of 10 STRUCTURE runs at K = 3. (C) Geographical distribution of genetic components. Red dots on the map are sampling locations. Each circle graph represents a population sample, with the frequency of the three genetic components inferred by STRUCTURE analysis (B) indicated by the colored sectors. Red dashed line denotes Wallace's biogeographic line. (D) Posterior distribution of the recombination parameters for seven Eastern Indonesian populations showing admixture. Posterior distribution of the recombination parameter r (breakpoints per centimorgan) estimated by STRUCTURE analysis is indicated with colors for populations as shown in the legend. The mean and 90% CI of r for each population are shown in Table 3. (E) Estimated admixture time in seven Eastern Indonesian populations. White bars indicate estimated admixture times with 90% CIs (scale on the left y axis); color bars denote the admixture proportion (fraction of Asian ancestry) in each population as indicated by the y axis on the right.
Fig. 2.
Fig. 2.
Analyses of the Affymetrix 6.0 dataset. (A) PCA. A plot of the first two principle components is shown. Population labels are abbreviated as the first three letters of the population name. (B) frappe results for K = 2 and K = 3. Each color indicates a different ancestry component. (C) Geographical distribution of genetic components. Red dots on the map are sampling locations. Each circle represents a population sample with the frequency of two ancestry components inferred by StepPCO and frappe analyses. The Moluccas are shaded in light blue. (D) Admixture estimate for autosomes vs. X chromosome. (E) Admixture time estimate. Simulated data from 100 simulations with a 40% migration rate are presented. Each curve represents a single admixed population. Average WT coefficients calculated for 100 chromosomes drawn at random from each population at exponentially growing time points are plotted as a function of time. Measurements obtained for the Molucca and the Nusa Tenggara populations are shown by blue horizontal lines. Red vertical lines indicate the time estimate, and shaded boxes define the CIs.

Comment in

References

    1. Bellwood PS, Fox JJ, Tryon DT. The Austronesians: Historical and Comparative Perspectives. Canberra, Australia: ANU E Press; 1995.
    1. Hill C, et al. A mitochondrial stratigraphy for island southeast Asia. Am J Hum Genet. 2007;80:29–43. - PMC - PubMed
    1. Soares P, et al. Climate change and postglacial human dispersals in southeast Asia. Mol Biol Evol. 2008;25:1209–1218. - PubMed
    1. Donohue M, Denham T. Farming and language in Island Southeast Asia: Reframing Austronesian history. Curr Anthropol. 2010;51:223–256.
    1. Karafet TM, et al. Major east-west division underlies Y chromosome stratification across Indonesia. Mol Biol Evol. 2010;27:1833–1844. - PubMed

Publication types

LinkOut - more resources