. 2012;8(3):e1002555.
doi: 10.1371/journal.ppat.1002555. Epub 2012 Mar 1.

Fungal-induced cell cycle impairment, chromosome instability and apoptosis via differential activation of NF-κB

Affiliations

Fungal-induced cell cycle impairment, chromosome instability and apoptosis via differential activation of NF-κB

Mariem Ben-Abdallah et al. PLoS Pathog. 2012.

Abstract

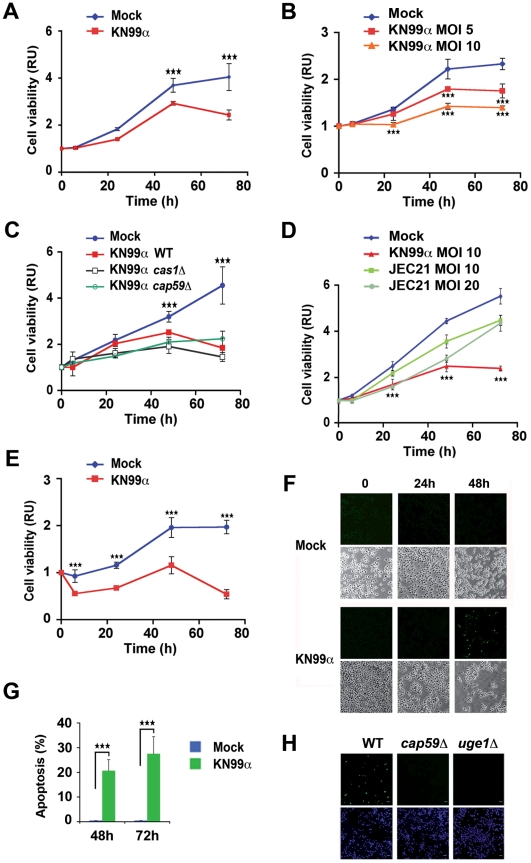
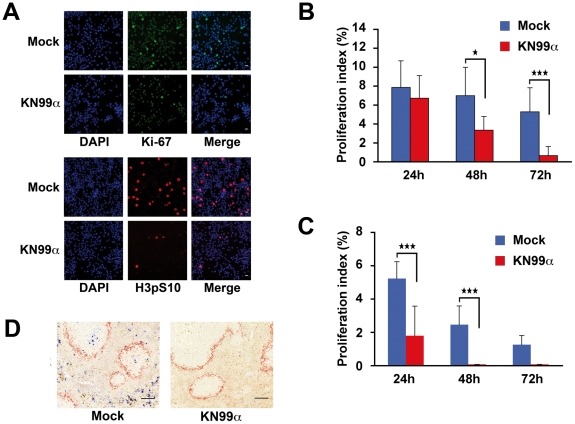
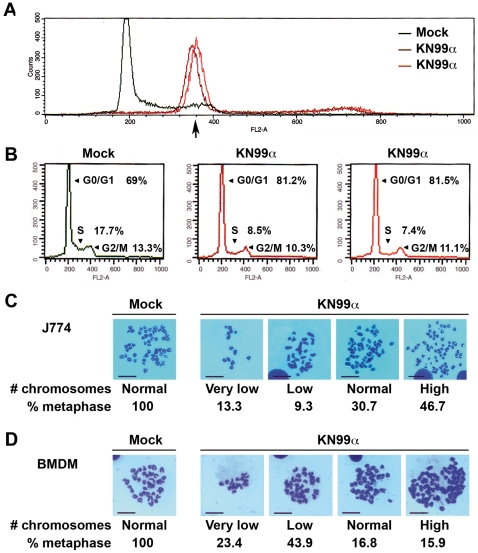
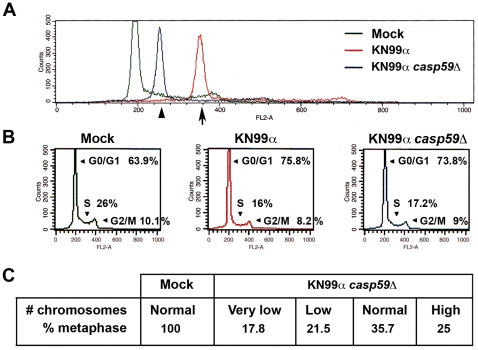
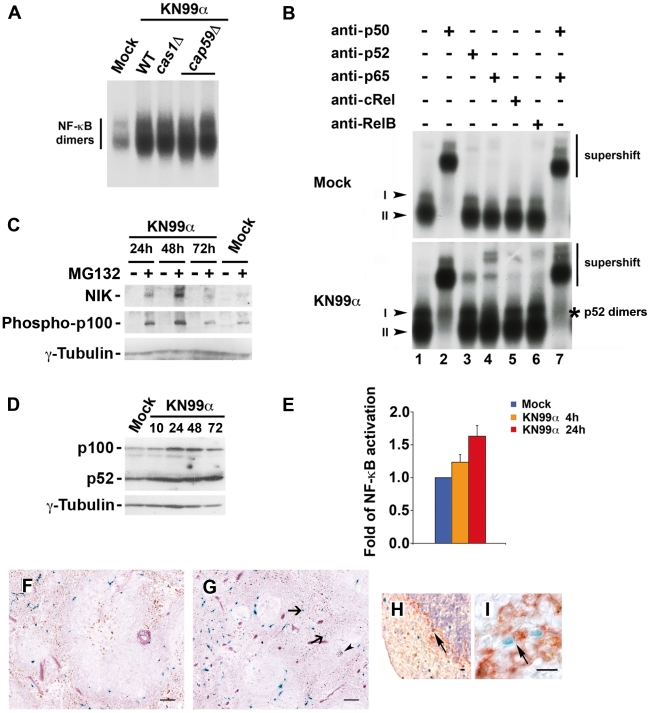
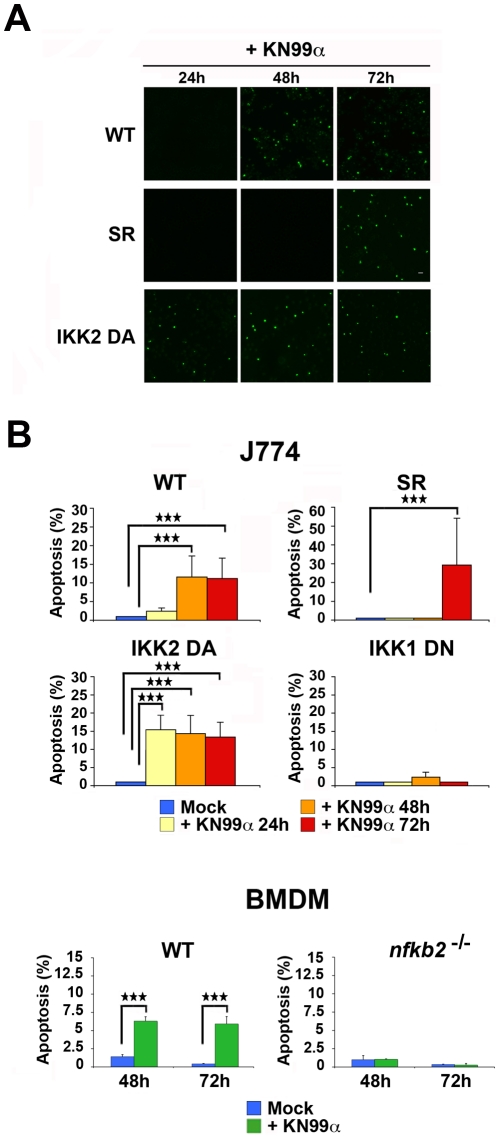
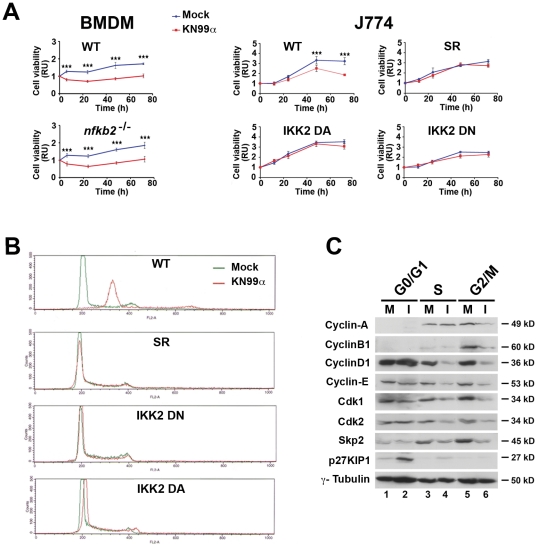
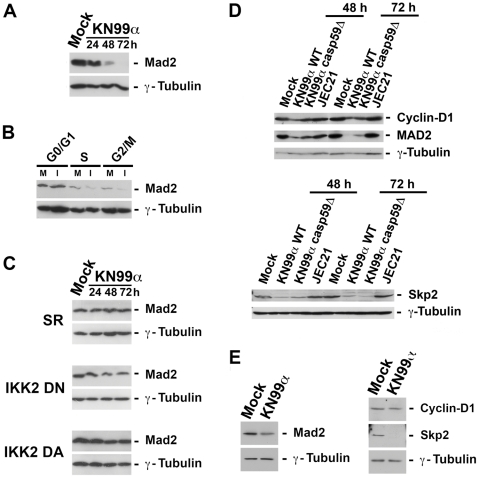
Microbial pathogens have developed efficient strategies to compromise host immune responses. Cryptococcus neoformans is a facultative intracellular pathogen, recognised as the most common cause of systemic fungal infections leading to severe meningoencephalitis, mainly in immunocompromised patients. This yeast is characterized by a polysaccharide capsule, which inhibits its phagocytosis. Whereas phagocytosis escape and macrophage intracellular survival have been intensively studied, extracellular survival of this yeast and restraint of host innate immune response are still poorly understood. In this study, we have investigated whether C. neoformans affected macrophage cell viability and whether NF-κB (nuclear factor-κB), a key regulator of cell growth, apoptosis and inflammation, was involved. Using wild-type (WT) as well as mutant strains of C. neoformans for the pathogen side, and WT and mutant cell lines with altered NF-κB activity or signalling as well as primary macrophages for the host side, we show that C. neoformans manipulated NF-κB-mediated signalling in a unique way to regulate macrophage cell fate and viability. On the one hand, serotype A strains reduced macrophage proliferation in a capsule-independent fashion. This growth decrease, which required a critical dosage of NF-κB activity, was caused by cell cycle disruption and aneuploidy, relying on fungal-induced modification of expression of several cell cycle checkpoint regulators in S and G2/M phases. On the other hand, C. neoformans infection induced macrophage apoptosis in a capsule-dependent manner with a differential requirement of the classical and alternative NF-κB signalling pathways, the latter one being essential. Together, these findings shed new light on fungal strategies to subvert host response through uncoupling of NF-κB activity in pathogen-controlled apoptosis and impairment of cell cycle progression. They also provide the first demonstration of induction of aneuploidy by a fungal pathogen, which may have wider implications for human health as aneuploidy is proposed to promote tumourigenesis.


Conflict of interest statement

The authors have declared that no competing interests exist.

Figures

Figure 1
Figure 1. Fungal infection decreases macrophage cell viability in a capsule-independent fashion and promotes capsule-dependent cell apoptosis.
(A) Time-course of cell viability of mock-treated or C. neoformans-infected (KN99α) J774 cells was assessed using a commercial viability assay generating a luminescent signal directly proportional to the amount of ATP present in metabolically active cells. Results are presented as fold relative to the cell viability in mock-treated cells at time 0. Data are mean ± s.e.m. (n = 6). ***, P<0.001. (B) Time-course of cell viability of J774 cells mock-treated or infected at different M.O.I. with C. neoformans (KN99α) assessed as mentioned above. Data are mean ± s.e.m. (n = 6). ***, P<0.001, compared with the mock-treated cells. (C) Time-course of cell viability of J774 cells mock-treated or infected by WT (KN99α) or capsule mutant C. neoformans strains (cas1D, cap59D), evaluated as mentioned above. Data are mean ± s.e.m. (n = 6). ***, P<0.001, compared with mock-treated cells. (D) Time-course of cell viability of J774 cells mock-treated or infected at different M.O.I. with serotype D C. neoformans (JEC21) assessed as mentioned above. Data are mean ± s.e.m. (n = 6). ***, P<0.001, compared with the mock-treated cells or with the JEC21-infected cells at M.O.I. 10 or with the JEC21-infected cells at M.O.I. 20, last time-point only. (E) Time-course of cell viability of BMDM cells mock-treated or C. neoformans-infected assessed as mentioned above. BMDM were cultured in presence of 30% CSF-conditioned medium from L929 cells and used directly without synchronization by M-CSF starvation. Data are mean ± s.e.m. (n = 6). ***, P<0.001, compared with mock-treated cells. (F) Representative TUNEL staining of J774 mock-treated or treated with C. neoformans (KN99α) at the indicated times (upper panels) and phase contrast microscopy images of the same cells (lower panels). (G) Quantification of the number of TUNEL+ BMDM mock-treated or C. neoformans-infected (KN99α) at the indicated time-points. BMDM were cultured in presence of 30% CSF-conditioned medium from L929 cells and used directly without synchronization by M-CSF starvation. Values are expressed as % of TUNEL+ cells for the total number of cells. Data are mean ± s.e.m. (n = 2). ***, P<0.001. (H) Representative TUNEL (top panels) and DAPI (bottom panels) staining of 48 h-infected J774 cells with wild-type (KN99α) or mutant C. neoformans strains (cap59D, lacking GXM the major capsule component and devoid of polysaccharide capsule or uge1D, lacking GalXM). Scale bar 20 µm.
Figure 2
Figure 2. Fungal infection decreases cell proliferation.
(A) Ki-67 or Phospho-H3 (H3pS10) immunofluorescence and DAPI staining of mock-treated or C. neoformans-infected (KN99α) J774 cells 48 h p.i.. Scale bar 20 µm. (B) Quantification of the number of Phospho-H3+ nuclei of mock-treated or C. neoformans-infected (KN99α) J774 cells at the indicated time-points. Proliferation index (%) is the number of Phospho-H3+ nuclei for the total number of cell nuclei (blue). Data are mean ± s.e.m. (n = 3). *, P<0.05. ***, P<0.001. (C) Quantification of the number of Phospho-H3+ nuclei of mock-treated or C. neoformans-infected (KN99α) BMDM at the indicated time-points. BMDM were cultured in presence of 30% CSF-conditioned medium from L929 cells and used directly without synchronization by M-CSF starvation. Proliferation index (%) is the number of Phospho-H3+ nuclei for the total number of cell nuclei. Data are mean ± s.e.m. (n = 3). ***, P<0.001. (D) Immunohistocytochemical analysis with antibodies against Phospho-H3 (H3pS10) (Blue) and the macrophage marginal zone marker MOMA-1 (red) from spleen sections of mock-treated or KN99α C. neoformans-infected κB-lacZ mice 3 d p.i.. Scale bar 100 µm. Representative panels are shown from n = 6 mice.
Figure 3
Figure 3. Fungal-induced cell growth inhibition reflects cell cycle impairment and aneuploidy.
(A) Representative flow cytometry histograms of cell cycle distribution of mock-treated or C. neoformans-infected (KN99α, 2 independent infections) J774 cells after 48 h, assessed by propidium iodide incorporation (n = 6). X-axis shows intensity of fluorescence and Y-axis number of cells. 30000 total events were acquired per sample with identical parameters of acquisition for all samples and data were analysed as described in Protocol S1. Arrow indicates an increase in DNA content. (B) Quantification of cells shown in (A) in G0/G1, S and G2/M phases by flow cytometry and analysis with the CellQuest software, with peak of G0/G1 arbitrarily positioned upon acquisition at 200 on the linear scale of FL2-A X-axis for each sample (30000 total events acquired). (C) Representative images of Giemsa-stained metaphase chromosomes from mock-treated or 48 h-infected J774 (n = 75 for infected and 23 for mock-treated cells). (D) Representative images of Giemsa-stained metaphase chromosomes from mock-treated or 48 h-infected BMDM (n = 107 for infected and 18 for mock-treated cells). BMDM were cultured in presence of 30% CSF-conditioned medium from L929 cells and used directly without synchronization by M-CSF starvation. Values indicated are % of metaphases with the following number of chromosomes: Very low (8–27), low (29–36) and high (50–114). Scale bar 50 µm.
Figure 4
Figure 4. Cell cycle impairment and aneuploidy are also triggered by acapsular strain.
(A) Representative flow cytometry histograms of cell cycle distribution of J774 cells, mock-treated or infected for 48 h with WT (KN99α) or acapsular mutant (cap59D) C. neoformans strains, assessed by propidium iodide incorporation (n = 3). X-axis shows intensity of fluorescence and Y-axis number of cells. 30000 total events were acquired per sample with identical parameters of acquisition for all samples and data were analysed as described in Protocol S1. Arrow indicates an increase in DNA content. (B) Quantification of cells shown in (A) in G0/G1, S and G2/M phases by flow cytometry and analysis with the CellQuest software, with peak of G0/G1 arbitrarily positioned upon acquisition at 200 on the linear scale of FL2-A X-axis for each sample (30000 total events acquired). (C) Table established from chromosome spreads of mock-treated J774 cells or of cells infected for 48 h with acapsular mutant strain (cap59D). n = 29 for infected and 18 for mock-treated cells. Values indicated are % of metaphases with the following number of chromosomes: Very low (8–27), low (29–36) and high (50–114).
Figure 5
Figure 5. Infection by C. neoformans induces NF-κB activation both in vitro and in vivo.
(A) Five µg of nuclear extracts from J774 cells mock-treated or infected for 24 h by WT (KN99α) or mutant C. neoformans strains (cas1D, cap59D) were analyzed by EMSA for their ability to bind to a double-stranded oligonucleotide corresponding to a canonical κB site from the MHC class I gene (n = 2). (B) Nuclear extracts (5 µg) from J774 cells mock-treated or infected for 24 h by WT C. neoformans strain (KN99α) were preincubated with preimmune serum or sera directed against each member of the NF-κB family alone or in combination, and analyzed by EMSA. Arrowheads point out the main complexes (I, II) visualized. * indicates specific p52-containing dimers (alternative pathway) (n = 3). (C) J774 cells were mock-treated or infected for the indicated times by WT C. neoformans strain (KN99α); 3 h before recovery and preparation of whole cell extracts, cells were pretreated (+) or not (−) with MG132 (20 µM); 100 µg of total protein extracts were then subjected to immunoblotting with anti-NIK or anti-Phospho-p100 or anti-γ-tubulin (internal loading control) antibodies (n = 2). (D) 25 µg of total protein extracts from J774 cells mock-treated or infected for the indicated times (h) by WT C. neoformans strain (KN99α) were analyzed by western blot with antibodies against p100 or γ-tubulin as an internal loading control. (E) J774 cells were transfected with a NF-κB-luciferase reporter plasmid containing the site from the enhancer of the Ig κ light chain gene (Igκ) together with an EF1-lacZ normalization vector. After 24 h, cells were mock-treated or infected with C. neoformans (KN99α) for the indicated times. Results are presented as fold relative to the activity in mock-treated cells. Data are mean ± s.e.m. (n = 3). (F) X-gal and Gomori-Grocott staining of a spleen section from control κB-lacZ mice counterstained with safranin. (G) X-gal and Gomori-Grocott staining of a spleen section from KN99α C. neoformans-infected κB-lacZ mice counterstained with safranin 3 d p.i.. Arrows, β-galactosidase+ cells (blue); arrowhead, yeasts (black). (H) X-gal staining and immunohistocytochemical analysis with antibody against the marginal zone macrophage marker MOMA-1 (red) from a spleen section of C. neoformans-infected κB-lacZ mice counterstained with hematoxylin 3 days p.i.. Arrow, double-stained β-galactosidase+MOMA-1+ cell. (I) X-gal staining and immunohistocytochemical analysis with antibody against the pan macrophage marker F4/80 (red) from a spleen section of C. neoformans-infected κB-lacZ mice 3 d p.i.. Arrow, double-stained β-galactosidase+F4/80+ cell. Scale bar 100 µm (F, G). Scale bar 10 µm (H, I). Representative panels are shown from n = 6 mice.
Figure 6
Figure 6. Both the classical and the alternative pathways of NF-κB activation contribute to fungal-induced apoptosis of macrophages, the alternative one being essential.
(A) TUNEL staining of SR or IKK2 DA mutant stable clones versus WT J774 cells infected with C. neoformans (KN99α) for 24, 48 or 72 h. Scale bar 20 µm. (B) Histogram showing the quantification of apoptosis by TUNEL assay for WT J774 and stable NF-κB-modulated clones mock-treated or infected by C. neoformans (KN99α) at different time-points and for C57BL/6 control or nfκb2 −/− BMDM at 48 and 72 h p.i.. Results are expressed as mean ± s.e.m of % of TUNEL+ cells relative to total cell number (n = 3). ***, P<0.001.
Figure 7
Figure 7. Fungal-alteration of cell cycle requires a critical NF-κB dosage and involves the modification of expression of several cell cycle regulators in G0/G1, S and G2/M phases.
(A) Time-course of cell viability of mock-treated or C. neoformans-infected (KN99α) C57BL/6 control or nfκb2 −/− BMDM or J774 cells, WT or stable NF-κB-modulated clones was assessed as mentioned previously. BMDM were cultured in presence of 30% CSF-conditioned medium from L929 cells and used directly without synchronization by M-CSF starvation. Results are presented as fold relative to the cell viability in mock-treated cells at time 0. Data are mean ± s.e.m. (BMDM n = 3, J774 n = 6). ***, P<0.001. (B) Representative flow cytometry histograms of cell cycle distribution of mock-treated or C. neoformans-infected (KN99α) WT J774 cells or stable NF-κB-modulated clones after 48 h, evaluated by propidium iodide incorporation (n = 6). (C) Representative western blot analysis of cyclins -D1, -E, -A, -B1, cyclin kinases, cdk1, cdk2 and Skp2, and cdk2 inhibitor, p27KIP1, expression levels in FACS-sorted viable cells stained with Hoechst at the different cell cycle phases. γ-tubulin was used as an internal loading control. 25 µg of total protein extracts were analyzed from mock-treated (M) or 48 h C. neoformans infected (KN99α) (I) WT J774 cells (n = 3).
Figure 8
Figure 8. NF-κB-dependent reduction of Mad2 levels upon fungal infection.
(A) Immunoblot analysis of the expression levels of Mad2 from total protein extracts (25 µg) of WT J774 mock-treated or infected by C. neoformans (KN99α) for the indicated time-points (n = 2). (B) Representative western blot analysis of Mad2 expression in FACS-sorted viable cells stained with Hoechst at the different cell cycle phases. 25 µg of total protein extracts were analyzed from mock-treated (M) or 48 h-infected KN99α C. neoformans (I) WT J774 cells (n = 3). (C) Immunoblot analysis of the expression levels of Mad2 from total protein extracts (25 µg) of stable J774 clones with impaired NF-κB activity/signalling (SR, IKK2 DN or IKK DA) mock-treated or infected by C. neoformans (KN99α) for the indicated time-points (n = 2). (D) Immunoblot analysis of the expression levels of Mad2, cyclin-D1 and Skp2 in total protein extracts (25 µg) from mock-treated J774 cells or from J774 cells infected with WT (KN99α) or acapsular mutant (cap59D) serotype A strains, or with serotype D strain (JEC21) at the indicated time-points (n = 2). (E) Immunoblot analysis of the expression levels of Mad2, cyclin-D1 and Skp2 in alveolar macrophage total protein extracts (25 µg) from mock-treated or KN99α C. neoformans-infected κB-lacZ mice 3 d p.i.. (n = 3). γ-tubulin was used as an internal loading control.

References

    1. Dromer F, Mathoulin-Pélissier S, Launay O, Lortholary O Group. FCS. Determinants of disease presentation and outcome during cryptococcosis: the CryptoA/D study. PLOS Med. 2007;4:e21. - PMC - PubMed
    1. Park BJ, Wannemuehler KA, Marston BJ, Govender N, Pappas PG, et al. Estimation of the current global burden of cryptococcal meningitis among persons living with HIV/AIDS. AIDS. 2009;23:525–530. - PubMed
    1. Idnurm A, Bahn YS, Nielsen K, Lin X, Fraser JA, et al. Deciphering the model pathogenic fungus Cryptococcus neoformans. Nat Rev Microbiol. 2005;3:753–764. - PubMed
    1. Hohl TM, Rivera A, Pamer EG. Immunity to fungi. Curr Opin Immunol. 2006;18:465–472. - PubMed
    1. Voelz K, May RC. Cryptococcal interactions with the host immune system. Eukaryot Cell. 2010;9:835–846. - PMC - PubMed

Publication types

MeSH terms