. 2012;8(3):e1002560.
doi: 10.1371/journal.ppat.1002560. Epub 2012 Mar 1.

Redundant Notch1 and Notch2 signaling is necessary for IFNγ secretion by T helper 1 cells during infection with Leishmania major

Affiliations

Redundant Notch1 and Notch2 signaling is necessary for IFNγ secretion by T helper 1 cells during infection with Leishmania major

Floriane Auderset et al. PLoS Pathog. 2012.

Abstract

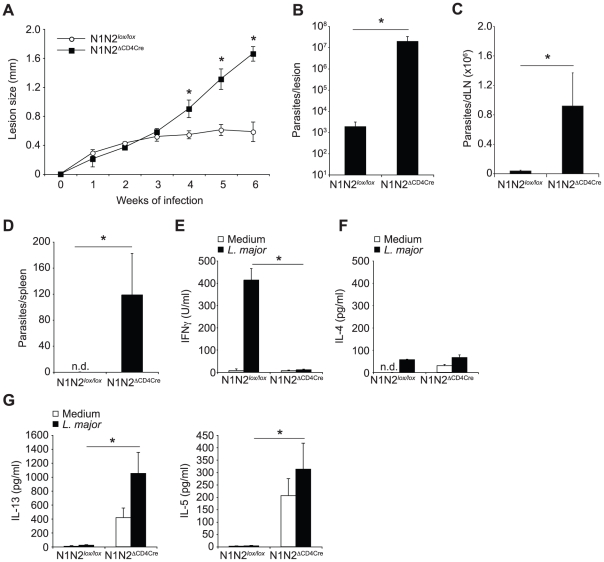
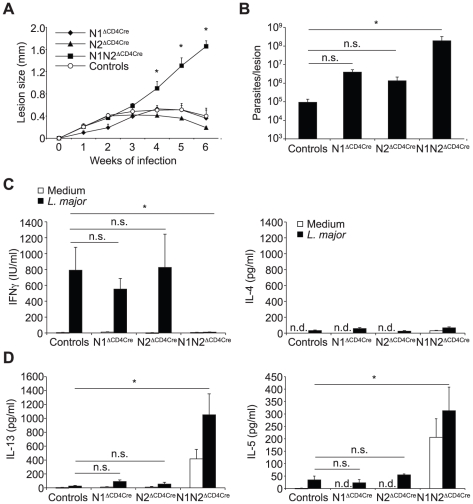
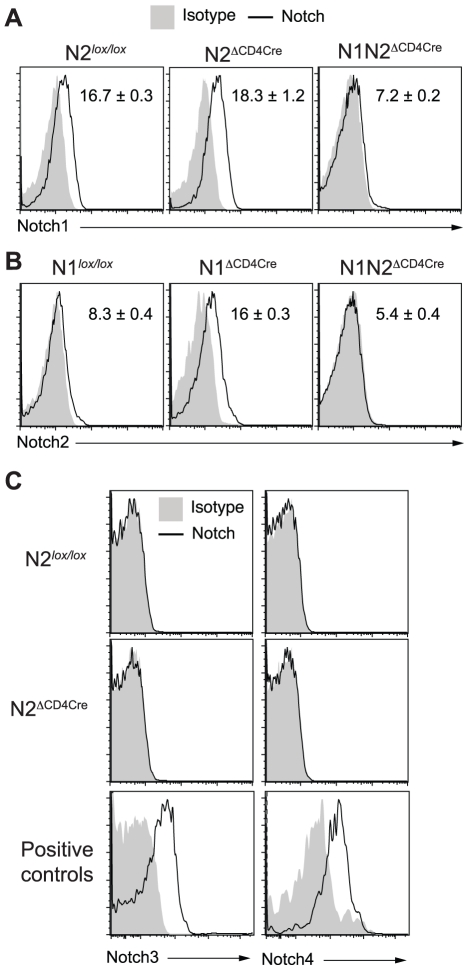
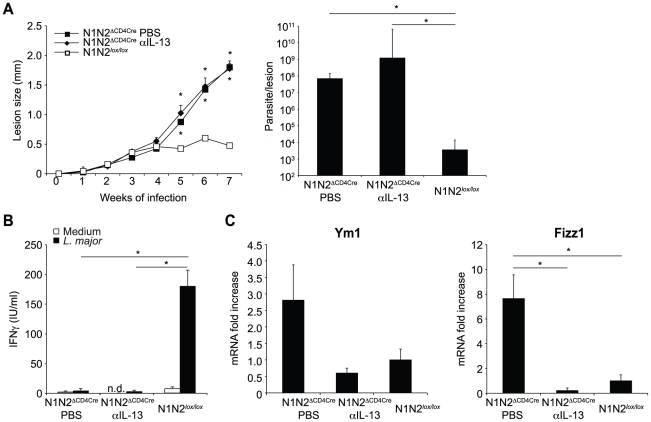
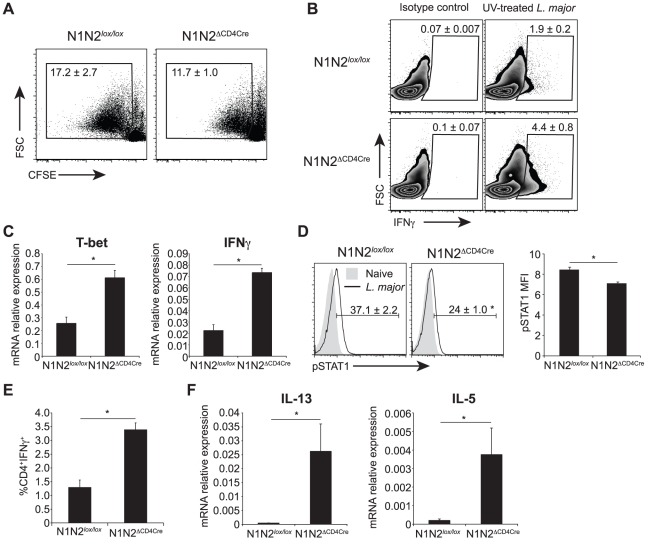
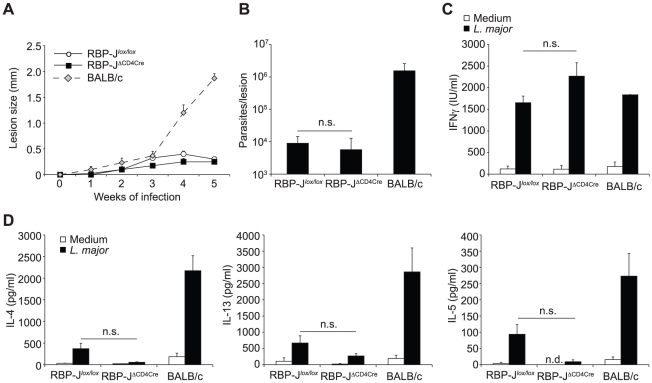
The protective immune response to intracellular parasites involves in most cases the differentiation of IFNγ-secreting CD4(+) T helper (Th) 1 cells. Notch receptors regulate cell differentiation during development but their implication in the polarization of peripheral CD4(+) T helper 1 cells is not well understood. Of the four Notch receptors, only Notch1 (N1) and Notch2 (N2) are expressed on activated CD4(+) T cells. To investigate the role of Notch in Th1 cell differentiation following parasite infection, mice with T cell-specific gene ablation of N1, N2 or both (N1N2(ΔCD4Cre)) were infected with the protozoan parasite Leishmania major. N1N2(ΔCD4Cre) mice, on the C57BL/6 L. major-resistant genetic background, developed unhealing lesions and uncontrolled parasitemia. Susceptibility correlated with impaired secretion of IFNγ by draining lymph node CD4(+) T cells and increased secretion of the IL-5 and IL-13 Th2 cytokines. Mice with single inactivation of N1 or N2 in their T cells were resistant to infection and developed a protective Th1 immune response, showing that CD4(+) T cell expression of N1 or N2 is redundant in driving Th1 differentiation. Furthermore, we show that Notch signaling is required for the secretion of IFNγ by Th1 cells. This effect is independent of CSL/RBP-Jκ, the major effector of Notch receptors, since L. major-infected mice with a RBP-Jκ deletion in their T cells were able to develop IFNγ-secreting Th1 cells, kill parasites and heal their lesions. Collectively, we demonstrate here a crucial role for RBP-Jκ-independent Notch signaling in the differentiation of a functional Th1 immune response following L. major infection.


Conflict of interest statement

The authors have declared that no competing interests exist.

Figures

Figure 1
Figure 1. N1N2ΔCD4Cre mice on the C57BL/6 L. major resistant background are susceptible to infection.
(A) N1N2ΔCD4Cre and control N1N2lox/lox mice were infected with 3×10⁶ L. major promastigotes and lesion size measured weekly. Dots represent group mean of lesion size ± SEM. (B, C) Six weeks after infection, parasite load was assessed by LDA in footpads (B), dLN (C) and spleen (D). Histograms represent the mean number of parasite ± SEM (n≥3 mice per group). (E–G) IFNγ (E), IL-4 (F), IL-13 and IL-5 (G) secretion was quantified in supernatants of draining lymph node cells restimulated or not with UV-irradiated L. major 6 weeks after infection. Mean cytokine secretion ± SEM are given (n≥3 mice per group). Data are representative of at least 3 individual experiments. n.d. not-detectable. * p-value<0.05 versus control mice.
Figure 2
Figure 2. N1 and N2 alone can drive CD4+ Th1 differentiation.
(A) N1ΔCD4Cre, N2ΔCD4Cre, N1N2ΔCD4Cre, and control mice were infected with 3×10⁶ L. major promastigotes and lesion size measured weekly. Data are represented as the mean of lesion size ± SEM with n≥3 mice per group. (B) Parasite load in the lesion was assessed by LDA 6 weeks after infection. Mean parasite number is given ± SEM (n≥3 mice per group) (C, D) Six weeks after infection, IFNγ (C), IL-4 and IL-13 (D) secretion was assessed in supernatant of dLN cells restimulated or not with UV-irradiated L. major for 72 h. Histograms show the mean cytokine secretion ± SEM (n≥3 mice per group). n.d. not-detectable, n.s. not significant. * p-value<0.05 versus control mice.
Figure 3
Figure 3. Increased N2 expression can compensate the absence of N1 on L. major stimulated CD4+ T cells.
(A–C) Three weeks after L. major infection, dLN cells from the indicated mouse strains were isolated and restimulated for 16 h with UV-treated L. major. Notch1 (A), Notch2 (B), Notch3 and Notch4 (C) expression by CD4+ T cells was assessed by FACS. CD11c+CD8α+ splenic dendritic cells and CD4CD8CD25+ thymocytes were stained as positive controls for Notch3 and Notch4 respectively. Representative flow cytometry plots are shown. Numbers in plots represent mean fluorescence intensity MFI ± SEM of ≥3 mice per group. Data are representative of 3 independent experiments.
Figure 4
Figure 4. Treatment with anti-IL-13 does not restore resistance of N1N2ΔCD4Cre mice to L. major.
(A) N1N2ΔCD4Cre and control N1N2lox/lox mice were infected s.c. with 3×10⁶ L. major promastigotes. At day 21 of infection, N1N2ΔCD4Cre mice were treated i.p. with either anti-IL-13 mAb or PBS as control. Treatment was repeated once a week until the end of the experiment, and lesion development was monitored. Group means of lesion size ± SEM (n≥3 mice per group) are represented. The parasite load at the site of infection was assessed by LDA 47 days post infection. Group means of parasite number are given ± SEM (n≥3 mice per group). (B) CD4+ T cells were isolated by MACS from dLN of L. major-infected mice 47 days post infection and restimulated with or without UV-treated L. major in presence of irradiated syngenic splenocytes. IFNγ level was measured in supernatant after 72 h of stimulation. Data are expressed as the group mean ± SEM of cytokine measurement of n≥3 draining lymph nodes (C) Ym1 and Fizz1 mRNA expression was analyzed in dLN cells by quantitative real-time PCR and normalized to HPRT mRNA expression. Results are represented as fold-increase in mRNA levels relative to levels measured in control mice ± SEM (n≥3 mice per group). Data are representative of three independent experiments. Similar results were obtained when anti-IL-13 was administrated 7 days post infection (data not shown). * p-value<0.05 versus control mice.
Figure 5
Figure 5. N1N2ΔCD4Cre mice transcribe T-bet and IFNγ in dLN CD4+ T cells but do not secrete it.
(A) Proliferation of CD4+ T cells was assessed by FACS. Draining LN cells of L. major-infected mice were isolated 6 weeks after infection, stained with CFSE and restimulated with UV-treated L. major for 72 h. Representative flow cytometry plots gated on CD4+ T cells are shown. Numbers in plots represent the mean percentage of proliferating cells ± SEM for 5 mice. (B) Intracellular levels of IFNγ were analysed by FACS in L. major-infected dLN cells restimulated for 72 h with UV-treated L. major. Representative flow cytometry plots are given. Numbers in plots represent the mean percentage of IFNγ+ cells within CD4+ T cells ± SEM for 5 mice. (C) Draining LN CD4+ T cells from N1N2ΔCD4Cre and N1N2lox/lox mice were sorted by FACS 21 days post L. major infection, T-bet and IFNγ mRNA levels were analyzed by quantitative RT-PCR. Data are represented as the mean ± SEM mRNA transcript levels normalized to HPRT mRNA levels (n≥3 mice per group). (D) Phosphorylation of STAT1 was assessed by FACS on dLN cells of N1N2ΔCD4Cre and N1N2lox/lox mice 3 weeks post infection. Naive mice were used as control. Representative flow cytometry plots gated on CD4+ T cells are shown. Numbers in quadrants indicate the mean frequency of pSTAT1+CD4+ T cells ± SEM. pSTAT1 mean fluorescence intensity MFI ± SEM is shown (n≥3 mice per group). (E) Draining LN cells of L. major-infected mice were restimulated ex vivo with PMA/ionomcyin for 4 h and level of intracellular IFNγ was assessed by FACS. The frequency of CD4+IFNγ+ T cells is given ± SEM for n≥3 mice per group. (F) mRNA expression of IL-13 and IL-5 was analyzed by quantitative real-time PCR in dLN cells isolated from N1N2ΔCD4Cre and N1N2lox/lox mice 6 weeks post L. major infection. Results are given as mean mRNA expression relative to HPRT ± SEM for n≥3 mice per group. Data are representative of 2–3 individual experiments. * p-value<0.05 versus control mice.
Figure 6
Figure 6. The impact of Notch signaling on Th1 differentiation is RBP-Jκ-independent.
(A) RBP-JκΔCD4Cre and RBP-Jκlox/lox mice were infected s.c. with 3×10⁶ L. major and lesion size measured weekly. Group mean of lesion size ± SEM for n≥3 mice per group is shown. (B) Parasite load in footpad was analyzed by LDA 5 weeks post infection. Data represent mean parasite number ± SEM for n≥3 mice per group. (C, D) IFNγ (C), IL-4, IL-13 and IL-5 (D) levels were measured in supernatant of dLN cells isolated from L. major-infected mice 5 weeks post infection and restimulated for 72 h with or without UV-treated L. major. Group mean of cytokine secretion ± SEM is given (n≥3 mice per group). n.s. not significant. * p-value<0.05 versus control mice.

References

    1. Radtke F, Fasnacht N, Macdonald HR. Notch signaling in the immune system. Immunity. 2010;32:14–27. - PubMed
    1. Sandy AR, Maillard I. Notch signaling in the hematopoietic system. Expert Opin Biol Ther. 2009;9:1383–1398. - PubMed
    1. Osipo C, Golde TE, Osborne BA, Miele LA. Off the beaten pathway: the complex cross talk between Notch and NF-kappaB. Lab Invest. 2008;88:11–17. - PubMed
    1. Kopan R, Ilagan MX. The canonical Notch signaling pathway: unfolding the activation mechanism. Cell. 2009;137:216–233. - PMC - PubMed
    1. Amsen D, Antov A, Flavell RA. The different faces of Notch in T-helper-cell differentiation. Nat Rev Immunol. 2009;9:116–124. - PubMed

Publication types

MeSH terms