. 2012;8(3):e1002561.
doi: 10.1371/journal.ppat.1002561. Epub 2012 Mar 1.

Visualization and measurement of ATP levels in living cells replicating hepatitis C virus genome RNA

Affiliations

Visualization and measurement of ATP levels in living cells replicating hepatitis C virus genome RNA

Tomomi Ando et al. PLoS Pathog. 2012.

Abstract

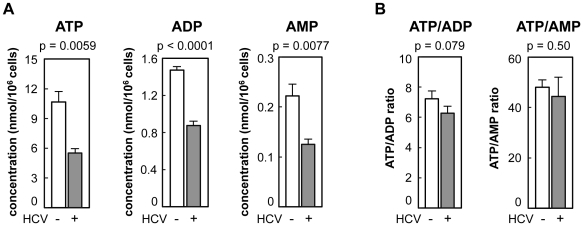
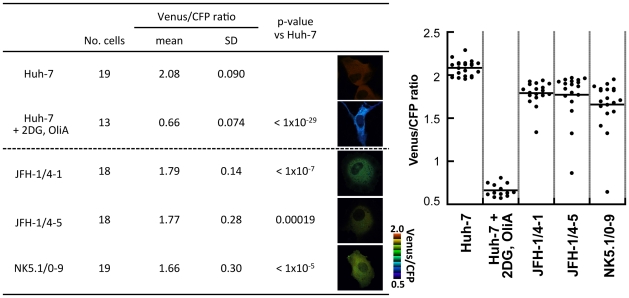
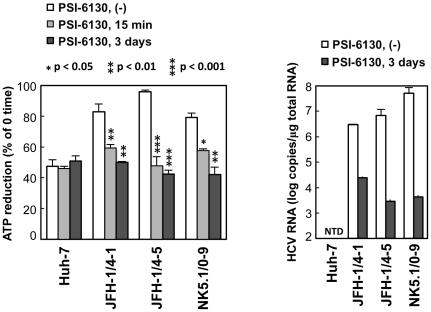
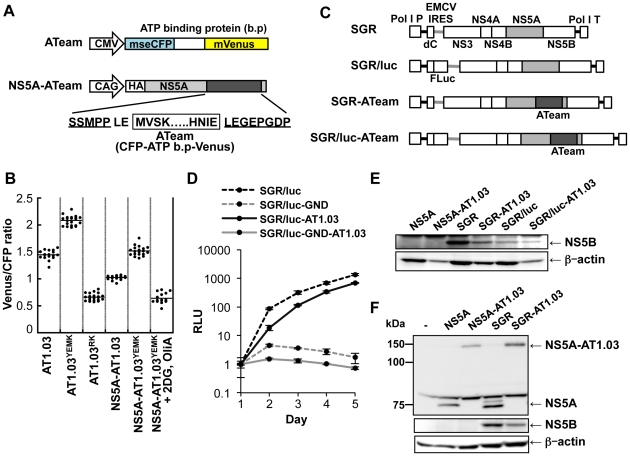
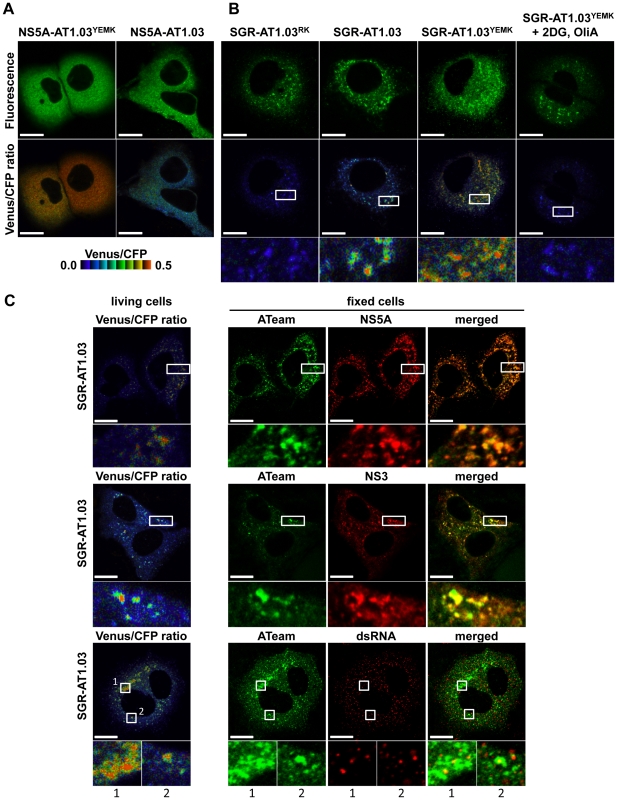
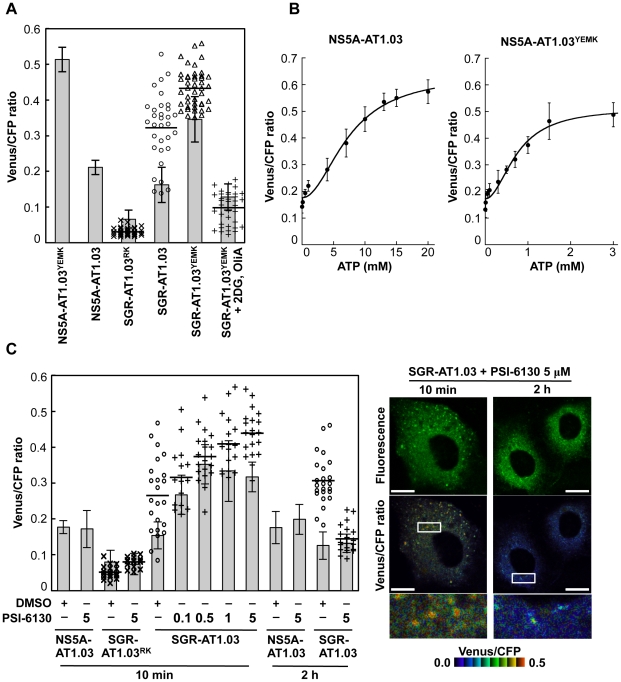
Adenosine 5'-triphosphate (ATP) is the primary energy currency of all living organisms and participates in a variety of cellular processes. Although ATP requirements during viral lifecycles have been examined in a number of studies, a method by which ATP production can be monitored in real-time, and by which ATP can be quantified in individual cells and subcellular compartments, is lacking, thereby hindering studies aimed at elucidating the precise mechanisms by which viral replication energized by ATP is controlled. In this study, we investigated the fluctuation and distribution of ATP in cells during RNA replication of the hepatitis C virus (HCV), a member of the Flaviviridae family. We demonstrated that cells involved in viral RNA replication actively consumed ATP, thereby reducing cytoplasmic ATP levels. Subsequently, a method to measure ATP levels at putative subcellular sites of HCV RNA replication in living cells was developed by introducing a recently-established Förster resonance energy transfer (FRET)-based ATP indicator, called ATeam, into the NS5A coding region of the HCV replicon. Using this method, we were able to observe the formation of ATP-enriched dot-like structures, which co-localize with non-structural viral proteins, within the cytoplasm of HCV-replicating cells but not in non-replicating cells. The obtained FRET signals allowed us to estimate ATP concentrations within HCV replicating cells as ∼5 mM at possible replicating sites and ∼1 mM at peripheral sites that did not appear to be involved in HCV replication. In contrast, cytoplasmic ATP levels in non-replicating Huh-7 cells were estimated as ∼2 mM. To our knowledge, this is the first study to demonstrate changes in ATP concentration within cells during replication of the HCV genome and increased ATP levels at distinct sites within replicating cells. ATeam may be a powerful tool for the study of energy metabolism during replication of the viral genome.


Conflict of interest statement

The authors have declared that no competing interests exist.

Figures

Figure 1
Figure 1. Levels of adenosine nucleotides in HCV-infected and non-infected Huh-7 cells determined by CE-TOF MS.
(A) ATP levels were reduced in HCV-infected cells. ATP, ADP, and AMP metabolites in Huh-7 cells with (gray bars) and without (open bars) HCV infection were measured by CE-TOFMS. (B) Ratios of ATP/ADP and ATP/AMP were calculated from the results depicted in (A). All data are presented as means and standard deviation (SD) values for three independent samples. Statistical differences between HCV-infected and non-infected cells were evaluated using Student's t-test.
Figure 2
Figure 2. ATP fluctuations within the cytoplasm of HCV replicating cells analyzed using the original ATeam.
Huh-7 cells carrying a HCV subgenomic replicon, JFH-1/4-1, JFH-1/4-5 (genotype 2a), and NK5.1/0-9 (genotype 1b) and parental Huh-7 cells were transfected with an ATP probe, AT1.03YEMK. Forty-eight hours after transfection, the Venus/CFP emission ratio in the cytoplasm of each cell was calculated from fluorescent images acquired with a confocal microscope FV1000 (Olympus). Huh-7 cells treated with 10 mM 2-DG and 10 µg/ml OliA for 20 min were used as a negative control. Data are presented as means and standard deviation values (SD) for each cell. Statistical differences among Huh-7 cells were evaluated using Student's t-test. Pseudocolored images of Venus channel/CFP channel ratios of representative cells and a pseudocolor scale are shown. In the graph on the right, each plot indicates the Venus/CFP ratio of each cell. The horizontal lines in the center represent the mean values for each group.
Figure 3
Figure 3. ATP consumption in cells replicating HCV RNA.
(Left) The indicated cell lines were pretreated with 10 µM PSI-6130 for 3 days or were cultured in the absence of the drug, followed by trypsinization and permeabilization. ATP-containing reaction buffer plus 10 µM PSI-6130 was added to some of the non-pre-treated cells (PSI-6130, 15 min; light gray bars). ATP-containing PSI-6130-free reaction buffer was added to the rest of the non pre-treated cells (PSI-6130, (−); white bars) and to the pre-treated cells (PSI-6130, 3 days; dark gray bars). After 15 min incubation, ATP levels in cell lysates were measured using a luciferase-based assay. ATP reduction compared to ATP levels at the 0-time point was calculated. The mean values of three independent samples with SD are displayed. Statistical differences between cells treated with and without treatment with PSI-6130 were evaluated using Student's t-test. (Right) HCV RNA titers in cells corresponding to the left panel were determined using real-time quantitative RT-PCR. Data are presented as means and SD for three independent samples. NTD indicates not detected.
Figure 4
Figure 4. Development of NS5A-ATeam and SGR-ATeam to enable real-time monitoring of ATP.
(A) Schematic representation of the ATeam and NS5A-ATeam used in this study. ATeam genes were inserted into the 3′ region of a HA-NS5A expression vector to generate NS5A-ATeam. The underlined sequences indicate NS5A residues. The insertion site was between residues 2394 and 2395, numbered according to the polyprotein of the HCV JFH-1 isolate. CMV, Cytomegalovirus promoter; CAG, CAG promoter; ATP b.p, ATP binding protein. HA, HA tag. (B) Huh-7 cells were transfected with ATeam and NS5A-ATeam constructs. Forty-eight hours post-transfection, the Venus/CFP ratios of each cell were calculated from fluorescent images acquired with a confocal microscope in the same way as described in the legends for Figure 2. Each plot shows the ratio of individual cells. Horizontal lines represent means. (C) Schematic representation of the SGR and SGR-ATeam plasmids used, with or without the firefly luciferase gene (Fluc). HCV polyproteins are indicated by the open boxes. ATeam genes were inserted into the same site in the NS5A C-terminal region. Bold lines indicate the HCV UTR. EMCV IRES is denoted by the gray bars. Pol I P, Pol I promotor; dC, 5′ region of Core gene; Pol I T, Pol I terminator. (D) Replication levels of SGR/luc-AT1.03 in transfected cells were determined by luciferase assay 1–5 days post-transfection. SGR/luc and SGR/luc-GND were used as positive and negative controls, respectively. Values given were normalized for transfection efficiency with luciferase activity determined 24 h post-transfection. All data are presented as means and SD for three independent samples. (E) Huh-7 cells were transfected with constructs encoding NS5A, NS5A-AT1.03, SGR, SGR-AT1.03, SGR/luc or SGR/luc-AT1.03, followed by immunoblotting with anti-NS5B or anti-beta-actin antibody. (F) Cells transfected with constructs encoding NS5A, NS5A-AT1.03, SGR or SGR-AT1.03 were analyzed by immunoblotting with anti-NS5A, anti-NS5B or anti-beta-actin antibodies.
Figure 5
Figure 5. Visualization of sites of focal accumulation of ATP in cells expressing NS5A-ATeam or SGR-ATeam.
(A) Huh-7 cells were transfected with NS5A-AT1.03 or NS5A-AT1.03YEMK. Four days after transfection, the cells were analyzed using spectral imaging (405-nm excitation) of LSM510-META (Carl Zeiss). Images were processed to the CFP channel (FCFP) and the Venus channel (FVenus) using a linear unmixing algorithm using a reference for each spectrum. The upper panels demonstrate the signal intensity from a spectral channel with maximum intensity and represent the expression pattern of NS5A-ATeam. The lower panels are constructed from FRET ratio images (FCFP/FVenus) with pseudocolors. The pseudocolor scale is shown below. Scale bars, 20 µm. (B) Huh-7 cells were transfected with SGR-AT1.03RK, SGR-AT1.03 or SGR-AT1.03YEMK, and were analyzed in the same way as described in (A). SGR-AT1.03YEMK -transfected cells were treated with 10 mM 2DG and 10 µg/ml OliA just before imaging and were used as a negative control. The upper panels demonstrate the intensity from a spectral channel with maximum intensity and represent the expression pattern of NS5A-ATeam processed from SGR-ATeam. The lower panels indicate square areas within FRET ratio panels magnified five-fold. Scale bars, 20 µm. (C) Cells were fixed after live-cell FRET imaging, and the same cell was analyzed by indirect immunofluorescence staining. Viral proteins were labeled with antibodies against NS5A (upper panels), NS3 (middle panels) and dsRNA (lower panels), which were detected with an Alexa Fluor 555-labeled anti-rabbit or anti-mouse antibody. ATeam panels (green) represent the expression of NS5A-ATeam processed from SGR-ATeam, and NS5A, NS3 or dsRNA panels (red) represent the immunostained signals. Enlarged views of the areas outlined by squares at a five-fold magnification are also shown. Scale bars, 20 µm.
Figure 6
Figure 6. Estimation of ATP levels at possible sites of HCV RNA replication in living cells.
(A) Venus/CFP emission ratios were calculated from images of CFP and Venus channels in individual cells for each group. Bar- and dotted graphs indicate ratios within the cytoplasm and ratios for dot-like structures, respectively, in the same cells, as shown in Figures 5A and 5B. Data in bar graphs are indicated as means and SD. Horizontal lines in the dot graphs denote means from at least three independent cells. Values in the cytoplasm of cells transfected with NS5A-AT1.03YEMK and SGR-AT1.03YEMK were statistically significant (p<0.05) as evaluated using the Student's t-test. (B) Calibration of NS5A-ATeam in cells under semi-intact conditions. Cells were transfected with NS5A-AT1.03 and NS5A-AT1.03YEMK, respectively. Forty-eight hours later, the cells were permeabilized, followed by addition of known concentrations of ATP. FRET analyses were performed as described in Figure 5A. Each trace represents mean with SD of at least six independent cells. Plots were fitted with Hill equations with a fixed Hill coefficient of 2; R = (Rmax−Rmin)×[ATP]2/([ATP]2+Kd 2)+Rmin, where Rmax and Rmin are the maximum and minimum fluorescence ratios, respectively. Kd is the apparent dissociation constant. R values were 0.994 and 0.986 for NS5A-AT1.03 and NS5A-AT1.03YEMK, respectively. (C) Cells were transfected with NS5A-AT1.03, SGR-AT1.03RK or SGR-AT1.03. The cells were then treated with PSI-6130 at indicated concentrations (µM) for 10 min or 2 h, and were analyzed as described in (A). Values in the cytoplasm of cells transfected with SGR-AT1.03 with and without PSI-6130 treatment were statistically significant (p<0.05 for control versus 0.1 or 1 µM PSI-6130, p<0.01 for control versus 0.5 or 5 µM PSI-6130) as evaluated using the Student's t-test. Representative cells treated with 5 µM PSI-6130 are shown in the right panel. The lower panel is a five-fold magnification of the boxed area. Scale bars, 20 µm.

References

    1. Ranji A, Boris-Lawrie K. RNA helicases: Emerging roles in viral replication and the host innate response. RNA Biol. 2010;7:775–787. - PMC - PubMed
    1. Imamura H, Nhat KP, Togawa H, Saito K, Iino R, et al. Visualization of ATP levels inside single living cells with fluorescence resonance energy transfer-based genetically encoded indicators. Proc Natl Acad Sci U S A. 2009;106:15651–15656. - PMC - PubMed
    1. Kato-Yamada Y, Yoshida M. Isolated epsilon subunit of thermophilic F1-ATPase binds ATP. J Biol Chem. 2003;278:36013–36016. - PubMed
    1. Iino R, Murakami T, Iizuka S, Kato-Yamada Y, Suzuki T, et al. Real-time monitoring of conformational dynamics of the epsilon subunit in F1-ATPase. J Biol Chem. 2005;280:40130–40134. - PubMed
    1. Yagi H, Kajiwara N, Tanaka H, Tsukihara T, Kato-Yamada Y, et al. Structures of the thermophilic F1-ATPase epsilon subunit suggesting ATP-regulated arm motion of its C-terminal domain in F1. Proc Natl Acad Sci U S A. 2007;104:11233–11238. - PMC - PubMed

Publication types