. 2012;8(3):e1002504.
doi: 10.1371/journal.pgen.1002504. Epub 2012 Mar 1.

Genomic tools for evolution and conservation in the chimpanzee: Pan troglodytes ellioti is a genetically distinct population

Affiliations

Genomic tools for evolution and conservation in the chimpanzee: Pan troglodytes ellioti is a genetically distinct population

Rory Bowden et al. PLoS Genet. 2012.

Abstract

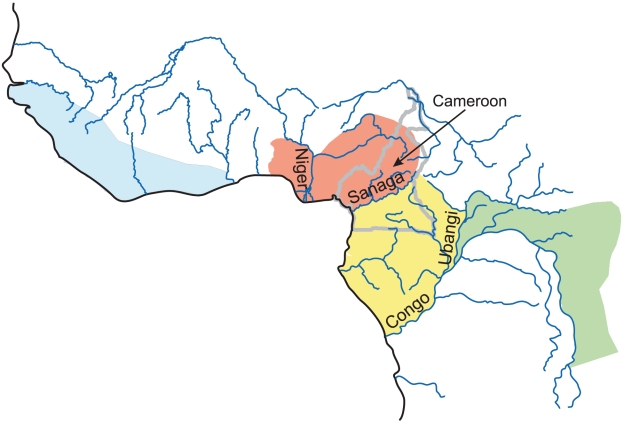
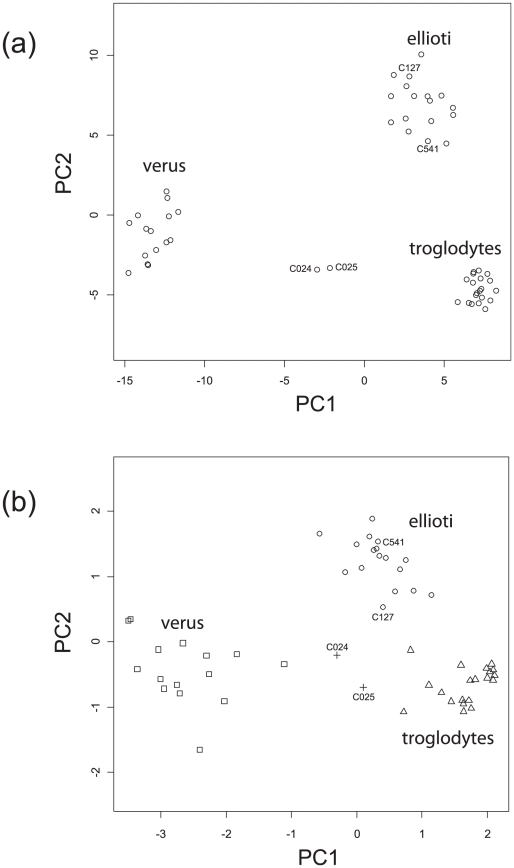
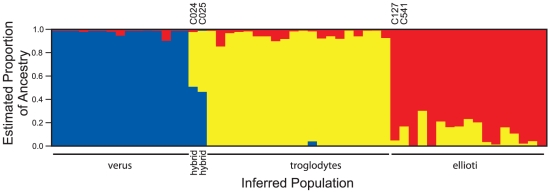
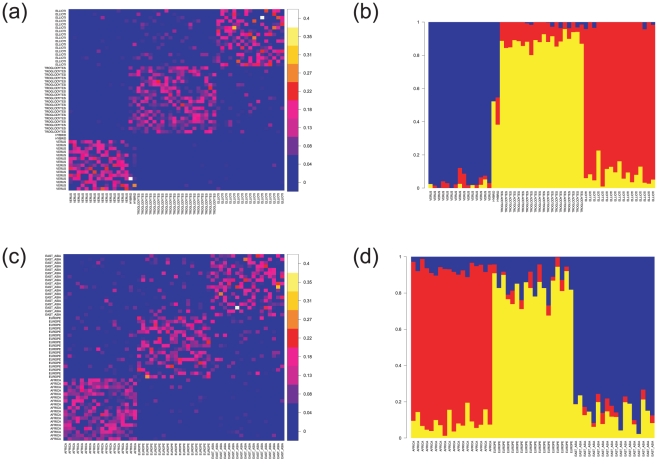
In spite of its evolutionary significance and conservation importance, the population structure of the common chimpanzee, Pan troglodytes, is still poorly understood. An issue of particular controversy is whether the proposed fourth subspecies of chimpanzee, Pan troglodytes ellioti, from parts of Nigeria and Cameroon, is genetically distinct. Although modern high-throughput SNP genotyping has had a major impact on our understanding of human population structure and demographic history, its application to ecological, demographic, or conservation questions in non-human species has been extremely limited. Here we apply these tools to chimpanzee population structure, using ∼700 autosomal SNPs derived from chimpanzee genomic data and a further ∼100 SNPs from targeted re-sequencing. We demonstrate conclusively the existence of P. t. ellioti as a genetically distinct subgroup. We show that there is clear differentiation between the verus, troglodytes, and ellioti populations at the SNP and haplotype level, on a scale that is greater than that separating continental human populations. Further, we show that only a small set of SNPs (10-20) is needed to successfully assign individuals to these populations. Tellingly, use of only mitochondrial DNA variation to classify individuals is erroneous in 4 of 54 cases, reinforcing the dangers of basing demographic inference on a single locus and implying that the demographic history of the species is more complicated than that suggested analyses based solely on mtDNA. In this study we demonstrate the feasibility of developing economical and robust tests of individual chimpanzee origin as well as in-depth studies of population structure. These findings have important implications for conservation strategies and our understanding of the evolution of chimpanzees. They also act as a proof-of-principle for the use of cheap high-throughput genomic methods for ecological questions.


Conflict of interest statement

The authors have declared that no competing interests exist.

Figures

Figure 1
Figure 1. Map of the geographic distribution of four populations of common chimpanzee.
After , Figure 6b. Colours show the ranges of each population (yellow - P. t. troglodytes, red - P. t. ellioti, blue - P. t. verus, green - P. t. schweinfurthii) with major rivers indicated. The Sanaga River in Cameroon has been proposed to form the boundary between the ranges of P. t. ellioti and P. t. troglodytes.
Figure 2
Figure 2. Clustering of chimpanzees based on principal components.
(a) Clustering of chimpanzees based on principal components using data from 818 SNPs. Plots of the first two principal components of data from 818 SNPs show that chimpanzees in this study form three genetically distinct groups. Two chimpanzees (C127, C541) have P. t. troglodytes-like mtDNA but group with P. t. ellioti at autosomal loci. Two chimpanzees (C024, C025) known to be hybrids between P. t. troglodytes and P. t. verus lie between these populations on the PCA plot. (b) Clustering of chimpanzees based on principal components using population-informative SNPs. Plots of the first two principal components of data from just 10 selected SNPs (Table S4) reveal the same three groups as the full dataset. Plotted positions are shown with jitter to separate individuals with the same genotypes at the subset of SNPs. Plotting characters show the inferred population of origin of each chimpanzee: (triangles - P. t. troglodytes, squares - P. t. ellioti, circles - P. t. verus, ‘+’ - hybrids).
Figure 3
Figure 3. Structure estimates of ancestry in three populations.
For each sampled individual the figure shows the estimated proportion of ancestry from Structure's three putative ancestral populations, with P. t. troglodytes in yellow, P. t. ellioti in red and P. t. verus in blue. Structure reveals the same pattern of group memberships as PCA, and additionally suggests that P. t. troglodytes and P. t. ellioti individuals may share more DNA from the other group than either shares with P. t. verus (blue). The two known hybrid individuals (C024, C025, with ancestry estimated at close to 50% in each of P. t. troglodytes and P. t. verus) and two P. t. ellioti chimpanzees with P. t. troglodytes-like mtDNA (C127, C541) are labelled.
Figure 4
Figure 4. Haplotype-based analyses of population relationships.
(a) (chimpanzee) and (c) (human): heat maps show the estimates from a copying model of the proportion of sampled genetic material of each individual (X axis) inferred to be closest to that in each other individual in the sample (Y axis). Human data was sampled from HapMap data for the three continental populations: Europe (CEU), Africa (YRI) and East Asia (Han Chinese, CHB) using an ascertainment scheme designed to match properties of SNPs in the chimpanzee data. Chimpanzees have less estimated copying from outside their own population than do humans. Individuals are labeled by their inferred (chimpanzee) or known (human) population of origin, or as hybrids. (b) and (d): summaries of estimated copying (ancestry) proportions by population, for each individual. (b) Chimpanzees: P. t. troglodytes in yellow, P. t. ellioti in red and P. t. verus in blue. P. t. troglodytes and P. t. ellioti appear to be less differentiated from other populations than is P. t. verus. (d) Human Continental populations: CEU Europe in yellow, YOR Africa in red and CHB East Asia in blue. Human individuals have higher proportions of ancestry from other populations than do chimpanzees.

References

    1. Oates JF, Groves CP, Jenkins PD. The type locality of Pan troglodytes vellerosus (Gray, 1862), and implications for the nomenclature of West African chimpanzees. Primates. 2009;50:78–80. - PubMed
    1. Gonder MK, Oates JF, Disotell TR, Forstner MR, Morales JC, et al. A new west African chimpanzee subspecies? Nature. 1997;388:337. - PubMed
    1. Gonder MK, Disotell TR, Oates JF. New genetic evidence on the evolution of chimpanzee populations and implications for taxonomy. Int J Primatol. 2006;27:1103–1127.
    1. Groves CP. Primate Taxonomy. Washington DC: Smithsonian Institution Press; 2001. 350
    1. Grubb P, Butynski T, Oates JF, Bearder S, Disotell T, et al. Assessment of the diversity of African primates. Int J Primatol. 2003;24:1301–1357.

Publication types

Substances