. 2012 Oct;61(5):851-69.
doi: 10.1093/sysbio/sys037. Epub 2012 Mar 7.

The effect of geographical scale of sampling on DNA barcoding

Affiliations

The effect of geographical scale of sampling on DNA barcoding

Johannes Bergsten et al. Syst Biol. 2012 Oct.

Abstract

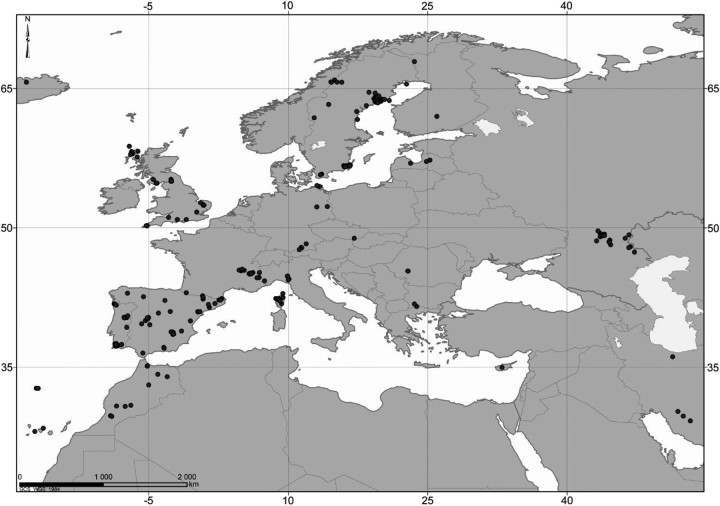
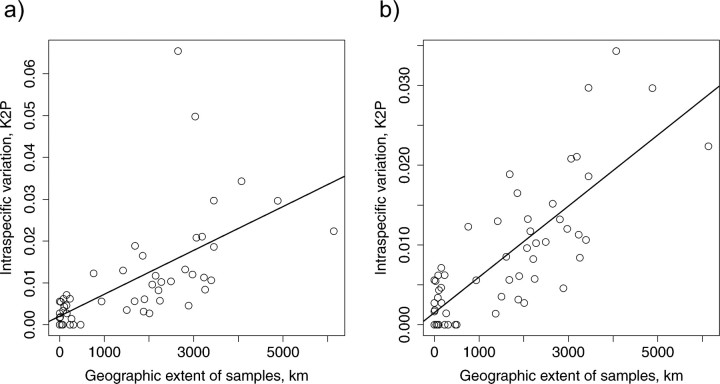
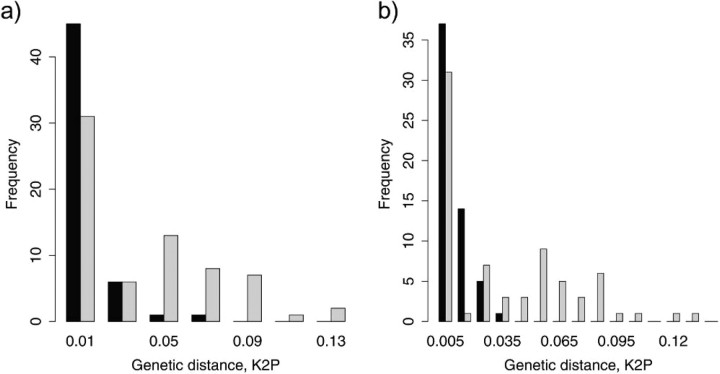
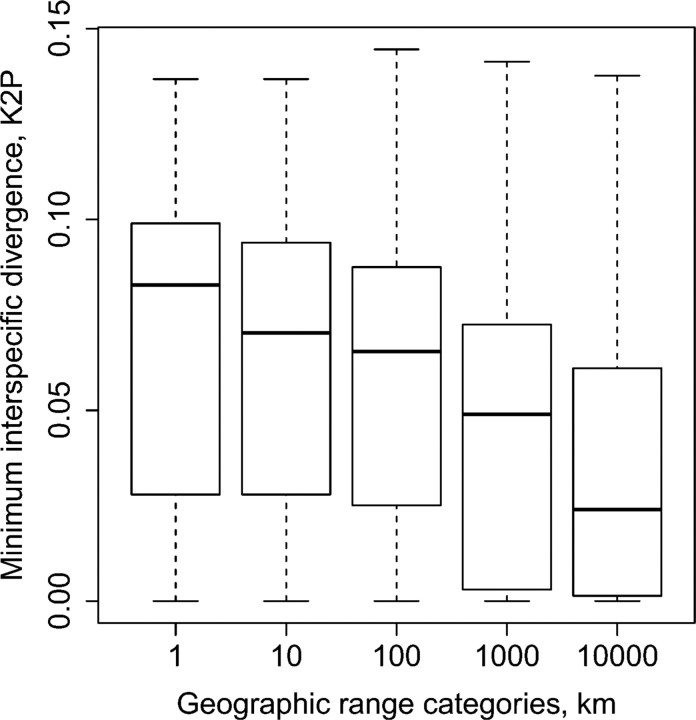
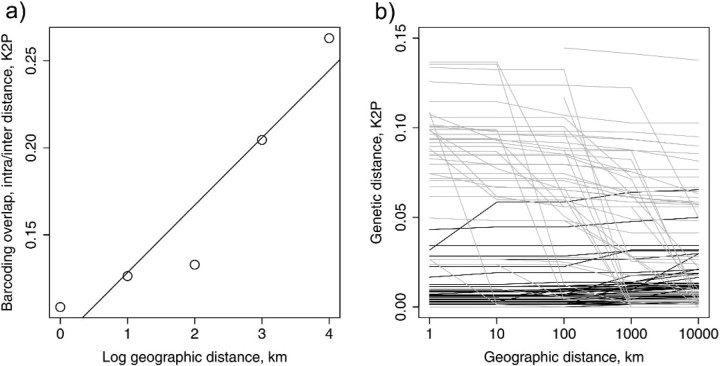
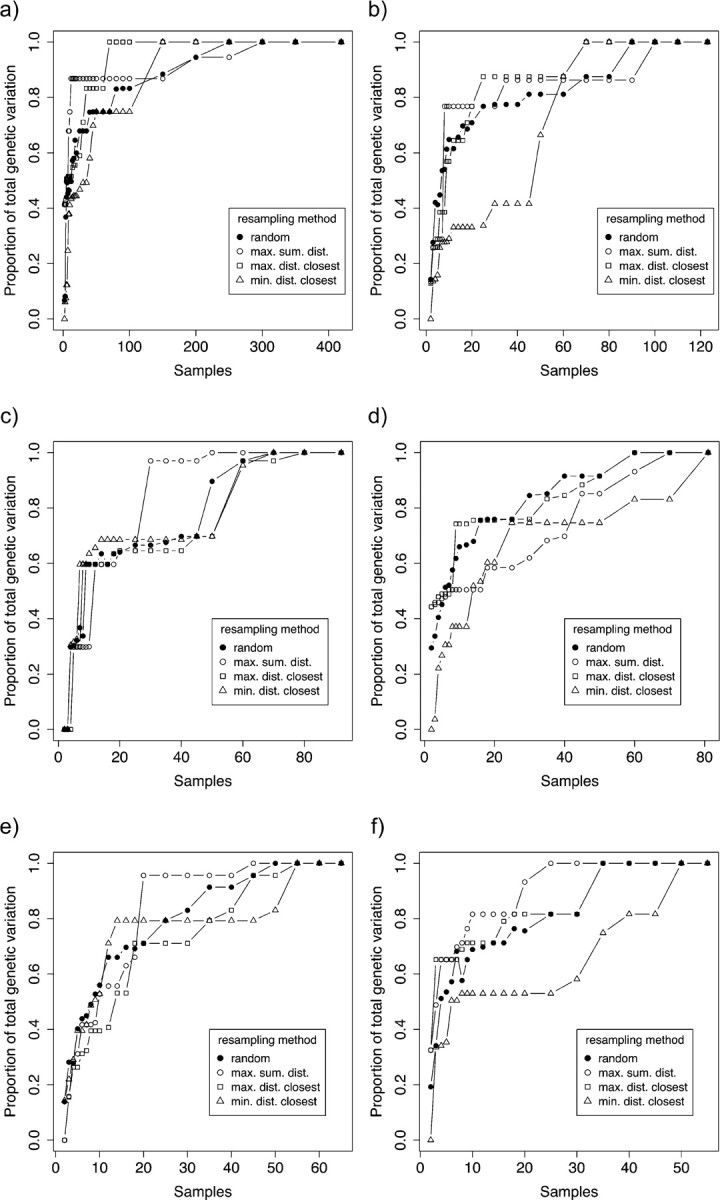
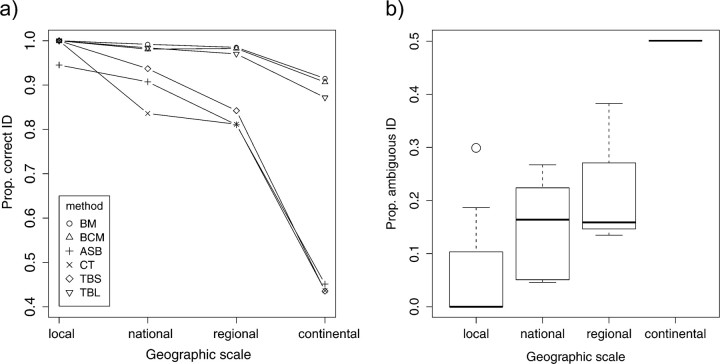
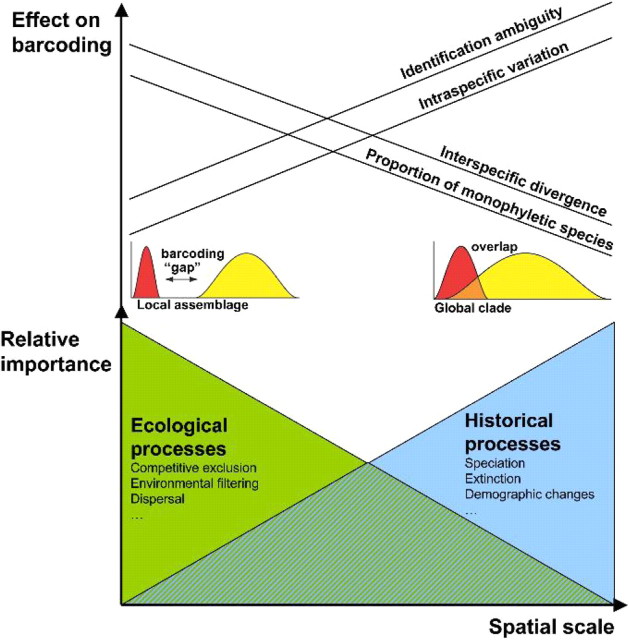
Eight years after DNA barcoding was formally proposed on a large scale, CO1 sequences are rapidly accumulating from around the world. While studies to date have mostly targeted local or regional species assemblages, the recent launch of the global iBOL project (International Barcode of Life), highlights the need to understand the effects of geographical scale on Barcoding's goals. Sampling has been central in the debate on DNA Barcoding, but the effect of the geographical scale of sampling has not yet been thoroughly and explicitly tested with empirical data. Here, we present a CO1 data set of aquatic predaceous diving beetles of the tribe Agabini, sampled throughout Europe, and use it to investigate how the geographic scale of sampling affects 1) the estimated intraspecific variation of species, 2) the genetic distance to the most closely related heterospecific, 3) the ratio of intraspecific and interspecific variation, 4) the frequency of taxonomically recognized species found to be monophyletic, and 5) query identification performance based on 6 different species assignment methods. Intraspecific variation was significantly correlated with the geographical scale of sampling (R-square = 0.7), and more than half of the species with 10 or more sampled individuals (N = 29) showed higher intraspecific variation than 1% sequence divergence. In contrast, the distance to the closest heterospecific showed a significant decrease with increasing geographical scale of sampling. The average genetic distance dropped from > 7% for samples within 1 km, to < 3.5% for samples up to > 6000 km apart. Over a third of the species were not monophyletic, and the proportion increased through locally, nationally, regionally, and continentally restricted subsets of the data. The success of identifying queries decreased with increasing spatial scale of sampling; liberal methods declined from 100% to around 90%, whereas strict methods dropped to below 50% at continental scales. The proportion of query identifications considered uncertain (more than one species < 1% distance from query) escalated from zero at local, to 50% at continental scale. Finally, by resampling the most widely sampled species we show that even if samples are collected to maximize the geographical coverage, up to 70 individuals are required to sample 95% of intraspecific variation. The results show that the geographical scale of sampling has a critical impact on the global application of DNA barcoding. Scale-effects result from the relative importance of different processes determining the composition of regional species assemblages (dispersal and ecological assembly) and global clades (demography, speciation, and extinction). The incorporation of geographical information, where available, will be required to obtain identification rates at global scales equivalent to those in regional barcoding studies. Our result hence provides an impetus for both smarter barcoding tools and sprouting national barcoding initiatives-smaller geographical scales deliver higher accuracy.


Figures

F<sc>IGURE</sc> 1.
FIGURE 1.
Geographical distribution of sampled localities including NCBI GenBank records.
F<sc>IGURE</sc> 2.
FIGURE 2.
Maximum intraspecific variation (K2P) against maximum geographic extent (km) of sampled individuals. (a) Agabus guttatus and Agabus biguttatus treated as one species each (linear regression, Y=5.25×10⁶x+2.05×10³, Adjusted R-square =0.384, P<0.001). (b) Outliers A. guttatus and A. biguttatus each subdivided into 3 species candidates (linear regression Y=4.45×10⁶x+1.52×10³, Adjusted R-square =0.626, P <0.001).
F<sc>IGURE</sc> 3.
FIGURE 3.
Histogram of maximum intraspecific variation (black) and minimum interspecific divergence (grey) for complete data set. (a) Agabus guttatus and A. biguttatus treated as one species each. (b) A. guttatus and A. biguttatus each subdivided into 3 species candidates. Note that closest interspecific divergence is recorded for each species so that sister species divergences are recorded twice in the frequency distribution.
F<sc>IGURE</sc> 4.
FIGURE 4.
The effect of geographic scale of sampling on the closest interspecific divergence. Minimum interspecific divergences across species in 5 distance categories. In each category, all interspecific distances between individuals with a pairwise geographical distance of less than the category value was calculated and the minimum was recorded for each species. Genetic distance is significantly smaller in the 10 000 km category compared with 1, 10, and 100 km category (one-way ANOVA, Tukey HSD, P <0.01).
F<sc>IGURE</sc> 5.
FIGURE 5.
The effect of geographic scale of sampling on the intraspecific × interspecific interaction. (a) Relationship between log geographic distance categories and the species differentiation, that is, the ratio between intraspecific variation and interspecific divergence. (b) Interspecific and intraspecific distances across 5 geographical distance categories separated by species. Each line represents a different species. gray = minimum interspecific distance, black = maximum intraspecific distance.
F<sc>IGURE</sc> 6.
FIGURE 6.
The effect of geographical scale of sampling on species monophyly. Categories equal: local (N= 19), national (N = 6), regional (N = 3), continental (N =1) see Table 2. Species with a single representative was not included in the total when calculating the proportion since they could not be nonmonophyletic.
F<sc>IGURE</sc> 7.
FIGURE 7.
Calibrated gene tree with a single representative terminal per species using a lognormal relaxed clock. Scale is in millions of years. Node values are posterior probability clade support. Bars represent the 95% HPD interval around the dated nodes (only for nodes >0.5 in posterior probability).
F<sc>IGURE</sc> 8.
FIGURE 8.
Proportion of total intraspecific genetic variation as a function of sample size. (a) Agabus bipustulatus, (b) A. sturmii, (c) A. didymus, (d) Ilybius fuliginosus, (e) A. nebulosus, (f) A. labiatus. Each data point is the median of 100 randomizations. Solid circle = random, open circle = maximum sum of geographic distances, square = maximum distance to closest geographical neighbor, triangle = minimum distance to closest geographical neighbor.
F<sc>IGURE</sc> 9.
FIGURE 9.
The effect of spatial scale on query identification success and ambiguity. (a) proportion of correctly identified queries using 6 different methods and given as the median value for each range category. Range category: local (N = 19), national (N =6), regional (N =3), continental (N =1). Methods: BM, Best match; BCM, best close match; ASB, all species barcode; CT, clustering threshold; TBS, tree based strict; TBL, tree based liberal. (b) Proportion of ambiguous query identifications defined as more than one reference species matching the query within the 1% threshold.
F<sc>IGURE</sc> 10.
FIGURE 10.
Schematic representation of relative importance of processes as spatial (and temporal) scale increases, and the effect on DNA barcoding parameters as found from this study. Note that the linear slopes are simplifications and that nature of the scale effects can be noncontinuous and chaotic across different domains of scale (e.g., see Wiens 1989). The small red and yellow graphs in the figure are originally from Meyer and Paulay (2005).

References

    1. Abdo Z, Golding B. A step toward barcoding life: a model-based, decision-theoretic method to assign genes to preexisting species groups. Syst. Biol. 2007;56:44–56. - PubMed
    1. Aradottir GI, Angus RB. A chromosomal analysis of some water beetle species recently transferred from Agabus Leach to Ilybius Erichson, with particular reference to the variation in chromosome number shown by I. montanus Stephens (Coleoptera: Dytiscidae) Hereditas. 2004;140:185–192. - PMC - PubMed
    1. Austerlitz F, David O, Schaeffer B, Bleakley K, Olteanu M, Leblois R, Veuille M, Laredo C. DNA barcode analysis: a comparison of phylogenetic and statistical classification methods. BMC Bioinformatics. 2009 10 (Suppl 14:S10) doi: 10.1186/1471-2105-10-S14-S10. - PMC - PubMed
    1. Avise JC. Cambridge (MA): Harvard University Press; 2000. Phylogeography: the history and formation of species; p. 447.
    1. Ayoub NA, Riechert SE, Small RL. Speciation history of the North American funnel web spiders, Agelenopsis (Araneae: Agelenidae): phylogenetic inferences at the population–species interface. Mol. Phylogenet. Evol. 2005;36:42–57. - PubMed

Publication types