. 2012 May;86(10):5422-36.
doi: 10.1128/JVI.06757-11. Epub 2012 Mar 7.

Plasticity and virus specificity of the airway epithelial cell immune response during respiratory virus infection

Affiliations

Plasticity and virus specificity of the airway epithelial cell immune response during respiratory virus infection

Ioannis Ioannidis et al. J Virol. 2012 May.

Abstract

Airway epithelial cells (AECs) provide the first line of defense in the respiratory tract and are the main target of respiratory viruses. Here, using oligonucleotide and protein arrays, we analyze the infection of primary polarized human AEC cultures with influenza virus and respiratory syncytial virus (RSV), and we show that the immune response of AECs is quantitatively and qualitatively virus specific. Differentially expressed genes (DEGs) specifically induced by influenza virus and not by RSV included those encoding interferon B1 (IFN-B1), type III interferons (interleukin 28A [IL-28A], IL-28B, and IL-29), interleukins (IL-6, IL-1A, IL-1B, IL-23A, IL-17C, and IL-32), and chemokines (CCL2, CCL8, and CXCL5). Lack of type I interferon or STAT1 signaling decreased the expression and secretion of cytokines and chemokines by the airway epithelium. We also observed strong basolateral polarization of the secretion of cytokines and chemokines by human and murine AECs during infection. Importantly, the antiviral response of human AECs to influenza virus or to RSV correlated with the infection signature obtained from peripheral blood mononuclear cells (PBMCs) isolated from patients with acute influenza or RSV bronchiolitis, respectively. IFI27 (also known as ISG12) was identified as a biomarker of respiratory virus infection in both AECs and PBMCs. In addition, the extent of the transcriptional perturbation in PBMCs correlated with the clinical disease severity. Our results demonstrate that the human airway epithelium mounts virus-specific immune responses that are likely to determine the subsequent systemic immune responses and suggest that the absence of epithelial immune mediators after RSV infection may contribute to explaining the inadequacy of systemic immunity to the virus.


Figures

Fig 1
Fig 1
Primary hAECs have a distinct transcriptional signature during RSV and influenza virus infection. Primary well-differentiated, polarized, ciliated hAEC cultures were infected with influenza A virus or RSV or mock treated. The cultures originated from two different donors. Total RNA was analyzed using Illumina-HTv12 v3.0 microarrays. (A) Unsupervised hierarchical clustering of transcripts and samples segregated hAECs into three distinct groups: controls, RSV infected, and influenza virus infected. (B) The MDTH was compared between experimental groups. The error bars indicate SD. (C) Heat maps of DEGs during RSV and influenza virus infection. Supervised analysis was performed using statistical filtering (P < 0.05; Benjamini statistical correction; 2-fold change). The numbers of upregulated and downregulated transcripts are indicated. (D) Venn diagram showing the common and virus-specific transcripts for each infection compared to noninfected controls. (E) Gene tree comparing the expression levels of the 4,454 virus-specific DEGs after normalization to their own controls. (F) Scatter plot of the relative expression of DEGs in influenza virus- and RSV-infected hAECs. The identities of representative upregulated DEGs are indicated.
Fig 2
Fig 2
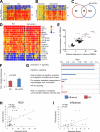
A common type I interferon-inducible signature in primary hAECs infected with RSV or influenza virus. (A) Comparison of the signature with 151 common genes among control and influenza virus- and RSV-infected hAECs. (B) Ingenuity pathway analysis (Fisher test, P < 0.05) revealed an interferon signaling canonical pathway in both infections. Different color intensities of ingenuity symbols indicate different levels of gene expression. Darker red indicates increased expression. (C) Transcriptional modular framework analyses of hAECs infected with RSV and influenza virus. To present the transcriptional changes graphically, the spots are aligned on a grid, with each position corresponding to a different functional module based on the original definitions (6). The spot intensity indicates the percentage of differentially expressed transcripts among the total number of transcripts detected for that module, whereas the spot color indicates the polarity of the change (red is upregulated, and blue is downregulated).
Fig 3
Fig 3
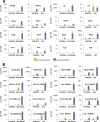
Basolateral polarization of cytokine and chemokine secretion in primary hAECs infected with RSV or influenza virus. Cell culture supernatants were harvested from the apical and basolateral compartments of RSV- or influenza virus-infected or control AEC cultures. Multiplex analysis was performed on a Luminex platform. Protein concentrations were normalized to the volume of the apical (200-μl) and the basal (1,500-μl) chambers. (A) Cytokines in the apical and basolateral supernatants of hAEC cultures. The error bars indicate SD. (B) Chemokines in the apical and basolateral supernatants of hAEC cultures. The error bars indicate SD.
Fig 4
Fig 4
Transcriptional signature of influenza virus infection in primary mAECs derived from wild-type, IFNAR−/−, or STAT1−/− mice. Primary well-differentiated, polarized, ciliated mAEC cultures were infected with influenza A virus or mock treated. Total RNA was analyzed using Agilent 014868 Whole Mouse Genome Microarray 4×44k G4122F (1 color). (A) Heat map of DEGs during influenza virus infection of mAECs. Supervised analysis was performed using statistical filtering (P < 0.05; Benjamini statistical correction; 2-fold change). The numbers of upregulated and downregulated transcripts are indicated. (B) Venn diagram showing the common and species-specific transcripts for human and murine AECs during influenza virus infection. A human strain of influenza A virus (Udorn) was used to infect human AECs, and a mouse-adapted influenza virus strain (WSN) was used to infect mouse AECs. (C) Comparison of the heat maps of DEGs during influenza virus infection of wild-type, IFNAR−/−, and STAT1−/− mAECs. Supervised analysis was performed using less stringent statistical filtering (P < 0.05; 2-fold change) than for panel A. The numbers of upregulated and downregulated transcripts are indicated. (D) Venn diagram showing the common and strain-specific transcripts for mAECs of wild-type, IFANR−/−, or STAT1−/− origin during influenza virus infection. (E) Gene tree comparing the expression levels of the 3,194 influenza virus-specific DEGs in mAECs of wild-type, IFANR−/−, or STAT1−/− origin after normalization to their own noninfected controls.
Fig 5
Fig 5
Reduced cytokine and chemokine secretion in primary mAECs deficient in IFNAR or STAT1 signaling during influenza virus infection. Cell culture supernatants were harvested from the apical and basolateral compartments of influenza virus-infected AEC cultures derived from wild-type, IFNAR−/−, or STAT1−/− mice. Multiplex analysis was performed on a Luminex platform. Protein concentrations were normalized to the volume of the apical (200-μl) and the basal (2,000-μl) chambers. (A) Cytokines in the apical and basolateral supernatants of wild-type, IFNAR−/−, and STAT1−/− mAEC cultures. The error bars indicate SD. (B) Chemokines in the apical and basolateral supernatants of wild-type, IFNAR−/−, and STAT1−/− mAEC cultures. The error bars indicate SD.
Fig 6
Fig 6
Molecular signatures in PBMCs from patients with acute RSV and influenza virus infection. (A) Heat map of DEGs in patients with RSV bronchiolitis compared with healthy controls. (B) Heat map of DEGs in patients with acute influenza compared with healthy controls. (C) Venn diagram showing the common and virus-specific transcripts for each infection normalized to healthy controls. (D) Comparison of the common 18-gene signature between RSV and influenza virus PBMCs. (E) Scatter plot of the relative expression of DEGs in PBMCs of influenza virus- and RSV-infected patients. The identities of representative upregulated DEGs are indicated. (F) Median expression levels of the interferon module in PBMCs from RSV- and influenza virus-infected patients. The error bars indicate SD. (G) Ingenuity pathway analysis of DEGs in PBMCs from RSV- and influenza virus-infected patients. The bars represent the frequency of transcripts from our data set that participate in the presented canonical pathway. (H) Correlation analysis of clinical score versus genomic score in PBMCs from influenza virus-infected patients. The clinical score measures disease severity in a range from 0 to 12 (see Materials and Methods). The genomic score shows the average perturbation of the upregulated DEGs. Each symbol represents a single patient. Spearman correlation, r = 0.42, P ≤ 0.004. (I) Correlation analysis of clinical score versus genomic score in PBMCs from RSV-infected patients. The analysis was performed as for panel H (r = 0.49; P ≤ 0.018).
Fig 7
Fig 7
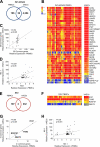
The transcriptional signatures induced by RSV and influenza virus correlate in hAECs and PBMCs. (A) Venn diagram showing the common and tissue-specific transcripts for influenza virus-infected samples in PBMCs and hAECs. (B) Heat map of the 36 common DEGs in PBMCs from patients with acute influenza and in influenza virus-infected hAECs. (C) Relative expression of the common DEGs in PBMCs from influenza patients and influenza virus-infected hAECs. Each symbol represents a single gene. Spearman correlation, r = 0.54, P < 0.001. (D) Relative expression of the interferon module transcripts in PBMCs from influenza patients and influenza virus-infected hAECs. Each symbol represents a single gene. r = 0.351, P < 0.05. (E) Venn diagram showing the common and tissue-specific transcripts for RSV-infected samples in PBMCs and hAECs. (F) Heat map of the 4 common DEGs in PBMCs from patients with RSV bronchiolitis and in RSV-infected hAECs. (G) Relative expression of the common DEGs in PBMCs from RSV-infected patients and RSV-infected hAECs. Each symbol represents a single gene. r = 0.98, P < 0.001. (H) Relative expression of the interferon module transcripts in PBMCs from RSV-infected patients and RSV-infected hAECs. Each symbol represents a single gene. r = 0.36, P < 0.001.

References

    1. Bals R, Hiemstra PS. 2004. Innate immunity in the lung: how epithelial cells fight against respiratory pathogens. Eur. Respir. J. 23:327–333 - PubMed
    1. Bernasconi D, Amici C, La Frazia S, Ianaro A, Santoro MG. 2005. The IkappaB kinase is a key factor in triggering influenza A virus-induced inflammatory cytokine production in airway epithelial cells. J. Biol. Chem. 280:24127–24134 - PubMed
    1. Berry MP, et al. 2010. An interferon-inducible neutrophil-driven blood transcriptional signature in human tuberculosis. Nature 466:973–977 - PMC - PubMed
    1. Bertrand P, Aranibar H, Castro E, Sanchez I. 2001. Efficacy of nebulized epinephrine versus salbutamol in hospitalized infants with bronchiolitis. Pediatr. Pulmonol. 31:284–288 - PubMed
    1. Bitko V, Barik S. 1998. Persistent activation of RelA by respiratory syncytial virus involves protein kinase C, underphosphorylated IkappaBbeta, and sequestration of protein phosphatase 2A by the viral phosphoprotein. J. Virol. 72:5610–5618 - PMC - PubMed

Publication types

MeSH terms