. 2012 May;86(10):5697-707.
doi: 10.1128/JVI.00146-12. Epub 2012 Mar 7.

Adaptation of a genotype 3 hepatitis E virus to efficient growth in cell culture depends on an inserted human gene segment acquired by recombination

Affiliations

Adaptation of a genotype 3 hepatitis E virus to efficient growth in cell culture depends on an inserted human gene segment acquired by recombination

P Shukla et al. J Virol. 2012 May.

Abstract

An infectious cDNA clone of a genotype 3 strain of hepatitis E virus adapted to growth in HepG2/C3A human hepatoma cells was constructed. This virus was unusual in that the hypervariable region of the adapted virus contained a 171-nucleotide insertion that encoded 58 amino acids of human S17 ribosomal protein. Analyses of virus from six serial passages indicated that genomes with this insert, although initially rare, were selected during the first passage, suggesting it conferred a significant growth advantage. RNA transcripts from this cDNA and the viruses encoded by them were infectious for cells of both human and swine origin, the major host species for this zoonotic virus. Mutagenesis studies demonstrated that the S17 insert was a major factor in cell culture adaptation. Introduction of 54 synonymous mutations into the insert had no detectable effect, thus implicating protein, rather than RNA, as the important component. Truncation of the insert by 50% decreased the levels of successful transfection by ~3-fold. Substitution of the S17 sequence by a different ribosomal protein sequence or by GTPase-activating protein sequence resulted in a partial enhancement of transfection levels, whereas substitution with 58 amino acids of green fluorescent protein had no effect. Therefore, both the sequence length and the amino acid composition of the insert were important. The S17 sequence did not affect transfection of human hepatoma cells when inserted into the hypervariable region of a genotype 1 strain, but this chimeric genome acquired a dramatic ability to replicate in hamster cells.


Figures

Fig 1
Fig 1
Diagram of the HEV genome summarizing the location and size, in amino acids, of nonviral sequences inserted into the HVR region. S17, human S17 ribosomal protein fragment in the Kernow strain; GTPase, GTPase-activating protein fragment in the Kernow strain; S19, S19 ribosomal protein fragment in the LBPR strain (21).
Fig 2
Fig 2
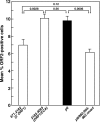
Transfection of S10-3 cells with sequential plasmid constructs. Representative flow cytometry profiles of nontransfected and transfected cells are shown on the left. Numbers beneath each clone indicate the fragment position on the genome that was replaced with the corresponding fragment amplified from the passage 6 virus quasispecies; the parentheses indicate gene regions included in the fragment. The new construct served as the background plasmid for the next replacement, and the procedure was repeated until all of the p1 had been replaced with p6 sequences. Finally, all plasmids were transcribed, transfected and immunostained for ORF2 protein in the same experiment: triplicate samples were harvested and tested by flow cytometry at 3 days posttransfection. Student t test P values are given for adjacent samples. P ≤ 0.05 was considered significant. Error bars indicate the standard deviations.
Fig 3
Fig 3
Reversion of aa 882, 904, and 965 in the X region reduces the level of successful transfection. S10-3 cells were transfected with the 5′ORF1 plasmid lacking the CCA and X region mutations (fragment 671-2182), the ORF1/CCA plasmid containing both the CCA and X region mutations (fragment 2182-3063), p6, and a revertant plasmid containing the CCA but not the X region mutations (p6/882; 904; 965 revert). Cells in triplicate samples were immunostained and analyzed by flow cytometry at 6 days posttransfection. P values are given, and error bars denote the standard deviations.
Fig 4
Fig 4
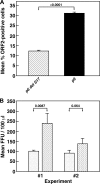
Removal of S17 sequence from p6 eliminates the adaptive effect of most point mutations. S10-3 cells were transfected with p1 and p6 plasmids with or without S17 sequence. Triplicate samples were analyzed by flow cytometry at day 4 posttransfection. P values were all <0.0001 except for p1/S17 versus p6delS17. Error bars denote the standard deviations.
Fig 5
Fig 5
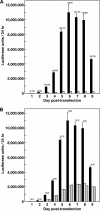
Expression of luciferase from ORF2 is substantial and prolonged in the presence of the S17 insert. The ORF2 viral capsid protein was replaced with the gaussia luciferase gene in p6 genomes lacking the S17 insert or the X gene region mutations. After transfection of S10-3 cells, culture medium was completely replaced every 24 h. (A) The ratio of luciferase units produced by p6/luc genomes with (solid bars) or without (hatched bars) the S17 insert is shown in parentheses above each time point. Error bars are standard deviation. (B) The average luciferase production from genomes encoded by two independent cDNA clones (stippled and crosshatched bars) lacking the three X gene mutations was decreased 2.3- to 5.1-fold compared to that from p6/luc genomes (ratios are shown in parentheses above each time point).
Fig 6
Fig 6
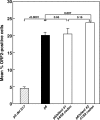
Synonymous mutations in the S17 insert have little effect on the efficiency of successful transfections. Mutations that preserved the amino sequence were introduced into the third base of 54/58 codons (mutant 1) or 41/58 codons (mutant 2) in theS17 insert, and RNA transcripts were transfected into S10-3 cells. The efficiency of successful transfection was determined by flow cytometry of triplicate samples at 6 days posttransfection.
Fig 7
Fig 7
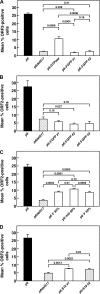
Comparison of efficiency of successful transfection by p6 genomic transcripts encoding different HVRs. Triplicate samples were subjected to flow cytometry at day 5 posttransfection. Error bars represent the standard deviation, and brackets denote Student t test P values. (A) The 174 nt encoding the 58-aa S17 insert were deleted or replaced with the 114-nt GTPase insert from passage 1 or with the 3′-terminal 174 nt of green fluorescent protein (GFP). #1 and #2 are two independent clones. P values for p6 versus any other genome were ≤0.0003. (B) 5′ 174 nt encoding the first 58 aa of GFP. # 1 to #3 are independent clones. P values for p6 versus any other genome were ≤0.001. (C) The 5′ half, middle, or 3′ half (87 nt) of the S17 insert replaced full-length S17. P values for p6 versus any other genome were ≤0.0002. (D) 117 nt S19 ribosomal protein gene insert. #1 and 2 are independent clones. The P values for p6 versus any other genome were ≤0.001, and the P values among the three GFP clones were ≤0.27.
Fig 8
Fig 8
Genomes or viruses encoded by p6 can replicate in, and infect swine LLC-PK1 cells. (A) Swine cells transfected with transcripts from p6delS17 or p6 containing the S17 insert were assayed by flow cytometry at day 5 posttransfection. (B) Triplicate samples of p6 virus harvested from the medium of transfected HepG2/C3A cells were titered in parallel on HepG2/C3A cells (open bars) and LLP-CK1 cells (stippled bars) under code.
Fig 9
Fig 9
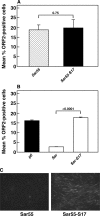
Effect of S17 insert on Sar55 successful transfection of S10-3 and BHK-21 cells. The efficiency of transfection of S10-3 (A) and BHK-21 (B) cells was monitored by flow cytometry. (C) Immunofluorescence microscopy of transfected BHK-21 cells stained for ORF2 protein at day 5 posttransfection.
Fig 10
Fig 10
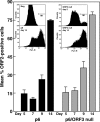
Lack of the ORF3 protein does not inhibit cell-to-cell spread in HepG2/C3A cultures. HepG2/C3A cells were electroporated with transcripts from p6 or p6/ORF3-null plasmids, mixed with naive HepG2/C3A cells and cultured at 37°C. Triplicate samples were harvested on each of indicated days, fixed with methanol, and stored at −80°C until assayed by flow cytometry. The results of representative flow cytometry scans are shown. Error bars indicate the standard deviation. P = 0.74 for day 5 values of the two viruses, indicating that a similar number of cells had been successfully transfected with each construct.

References

    1. Ahmad I, Holla RP, Jameel S. 2011. Molecular virology of hepatitis E virus. Virus Res. doi:10.1016/j.virusres.2011.02.11 - DOI - PMC - PubMed
    1. Charini WA, Todd S, Gutman GA, Semler BL. 1994. Transduction of a human RNA sequence by poliovirus. J. Virol. 68:6547–6552 - PMC - PubMed
    1. Dalton HR, Bendall RP, Keane FE, Tedder RS, Ijaz S. 2009. Persistent carriage of hepatitis E virus in patients with HIV infection. N. Engl. J. Med. 361:1025–1027 - PubMed
    1. Emerson SU, et al. 2004. In vitro replication of hepatitis E virus (HEV) genomes and of an HEV replicon expressing green fluorescent protein. J. Virol. 78:4838–4846 - PMC - PubMed
    1. Emerson SU, et al. 2010. Release of genotype 1 hepatitis E virus from cultured hepatoma and polarized intestinal cells depends on open reading frame 3 protein and requires an intact PXXP motif. J. Virol. 84:9059–9069 - PMC - PubMed

Publication types

LinkOut - more resources