. 2012 Feb 15;125(Pt 4):869-86.
doi: 10.1242/jcs.091090. Epub 2012 Mar 7.

Adenylyl cyclase AC8 directly controls its micro-environment by recruiting the actin cytoskeleton in a cholesterol-rich milieu

Affiliations

Adenylyl cyclase AC8 directly controls its micro-environment by recruiting the actin cytoskeleton in a cholesterol-rich milieu

Laura J Ayling et al. J Cell Sci. .

Abstract

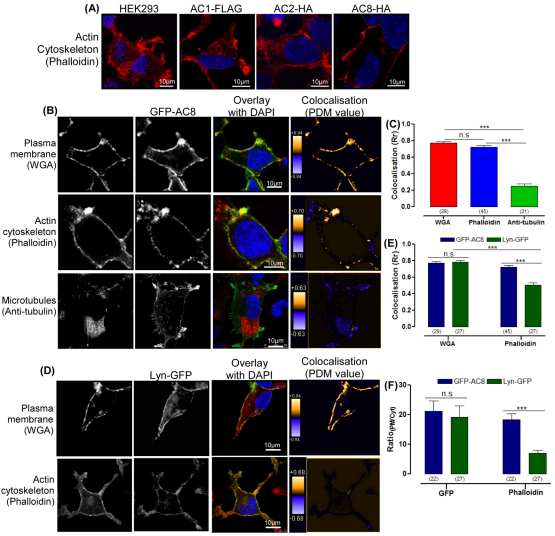
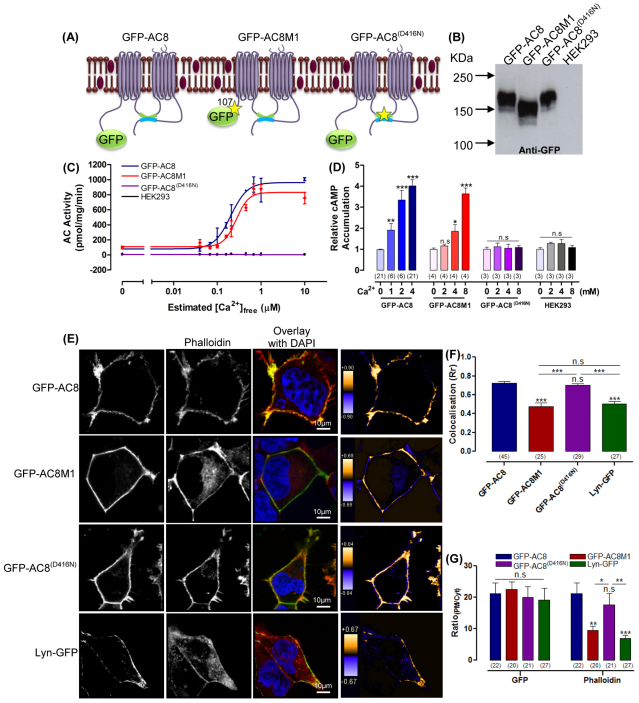
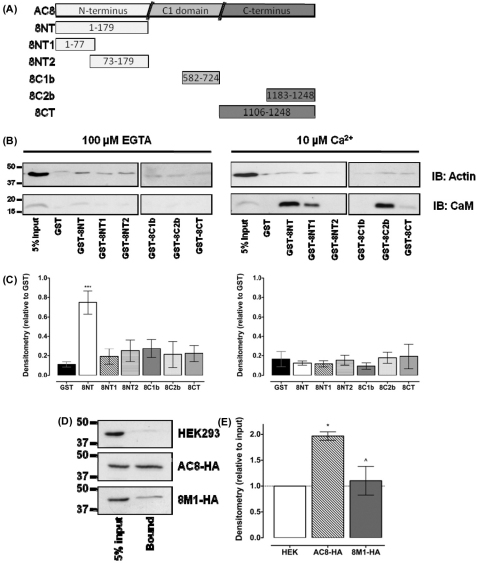
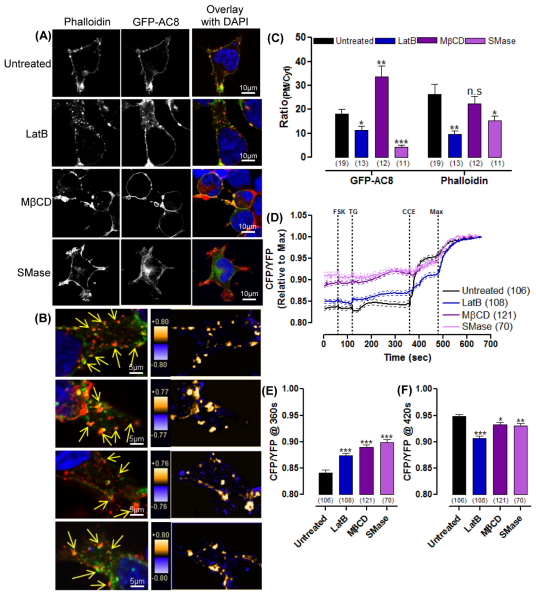
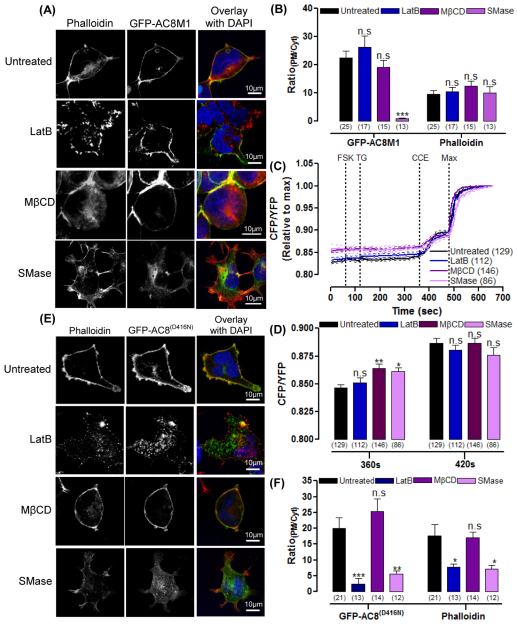
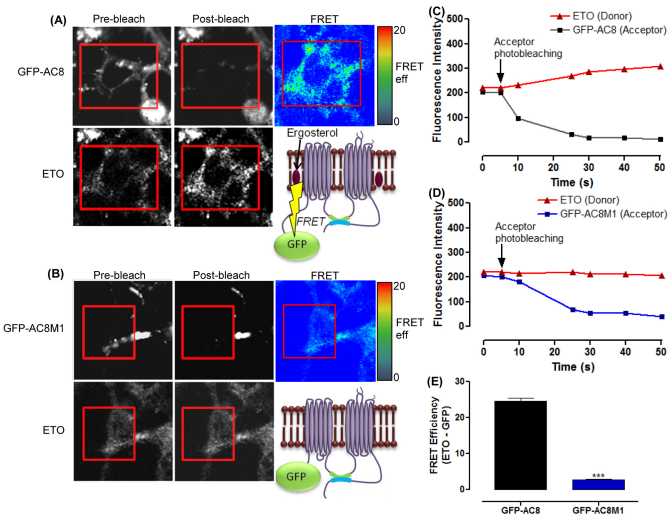
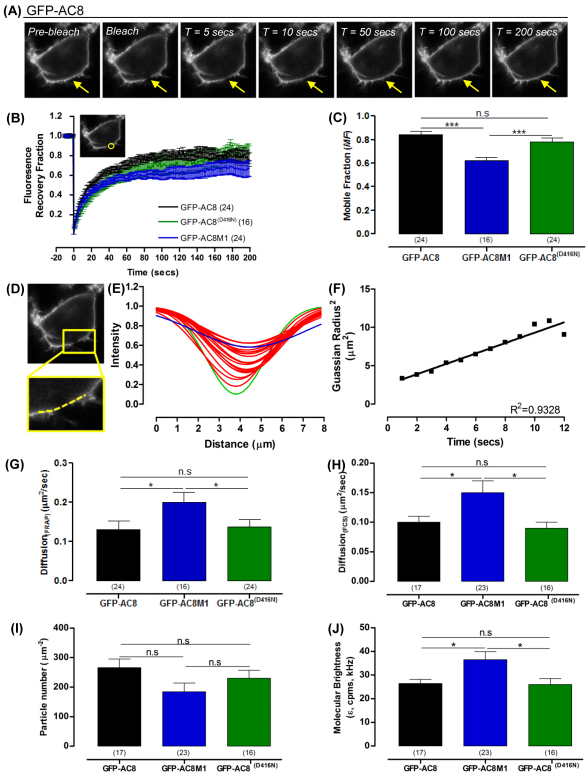
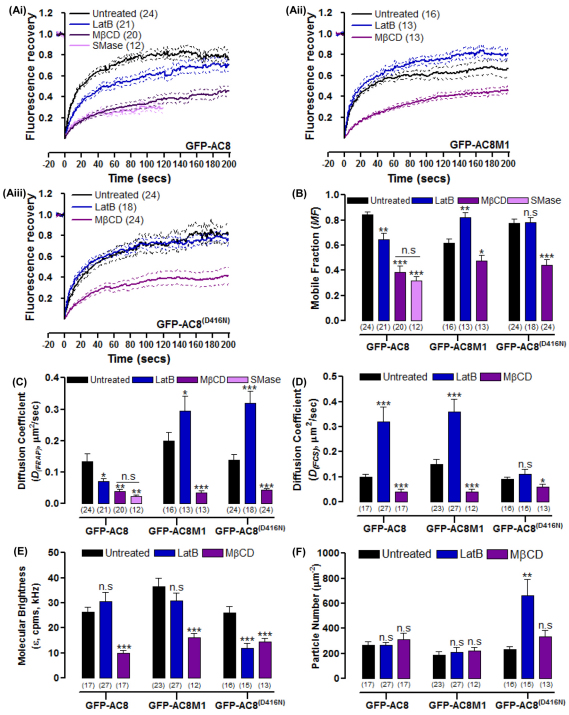
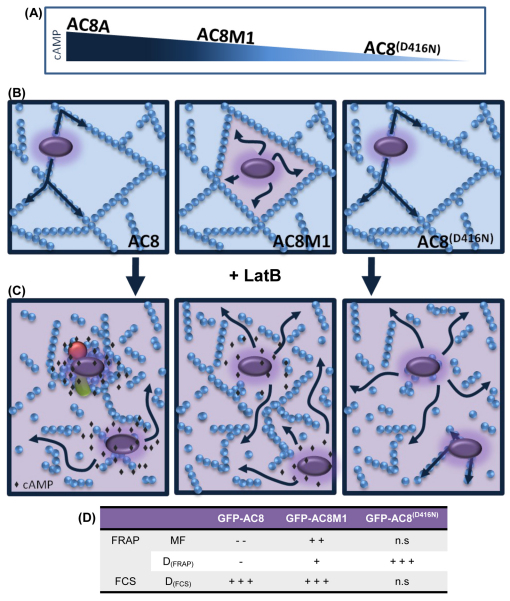
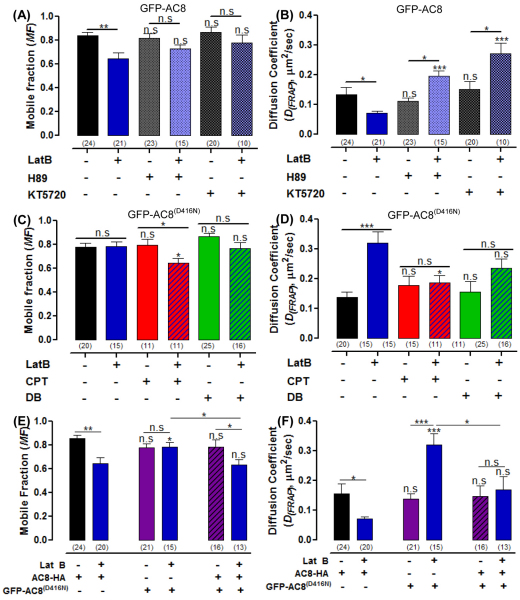
The central and pervasive influence of cAMP on cellular functions underscores the value of stringent control of the organization of adenylyl cyclases (ACs) in the plasma membrane. Biochemical data suggest that ACs reside in membrane rafts and could compartmentalize intermediary scaffolding proteins and associated regulatory elements. However, little is known about the organization or regulation of the dynamic behaviour of ACs in a cellular context. The present study examines these issues, using confocal image analysis of various AC8 constructs, combined with fluorescence recovery after photobleaching and fluorescence correlation spectroscopy. These studies reveal that AC8, through its N-terminus, enhances the cortical actin signal at the plasma membrane; an interaction that was confirmed by GST pull-down and immunoprecipitation experiments. AC8 also associates dynamically with lipid rafts; the direct association of AC8 with sterols was confirmed in Förster resonance energy transfer experiments. Disruption of the actin cytoskeleton and lipid rafts indicates that AC8 tracks along the cytoskeleton in a cholesterol-enriched domain, and the cAMP that it produces contributes to sculpting the actin cytoskeleton. Thus, an adenylyl cyclase is shown not just to act as a scaffold, but also to actively orchestrate its own micro-environment, by associating with the cytoskeleton and controlling the association by producing cAMP, to yield a highly organized signalling hub.


Figures

Fig. 1.
Fig. 1.
Expression of AC8 enhances cortical actin. (A) HEK293 cells stained with phalloidin, stably expressing AC1–FLAG, AC2–HA or AC8–HA, as determined by cAMP accumulation analysis (data not shown). (B) Cells expressing GFP–AC8 stained with WGA, phalloidin or anti-tubulin antibody; graphical representations of PDM values of colocalisation are shown in the right panels. (C) Colocalisation (Rr) analysis for B. (D) Cells expressing Lyn–GFP stained with WGA or phalloidin are shown in the right panels. (E) Colocalisation (Rr) analysis of GFP–AC8 or Lyn-GFP with WGA or phalloidin. (F) RatioPM/Cyt analysis of GFP–AC8, Lyn–GFP and phalloidin.
Fig. 2.
Fig. 2.
The N-terminus of AC8 redistributes the actin filaments. (A) Representation of GFP–AC8, GFP–AC8M1 and GFP–AC8 D416N (GFP–AC8(D416N)). (B) Western blot analysis of crude membranes from cells expressing GFP–AC8, GFP–AC8M1 or GFP–AC8 D416N. (C) Representative experiment measuring AC activity in membrane expressing GFP–AC8, GFP–AC8M1 or GFP–AC8 D416N in response to Ca2+. (D) cAMP accumulation in whole cells expressing GFP–AC8, GFP–AC8M1 or GFP–AC8 D416N in response to CCE. (E) Phalloidin-stained cells expressing GFP–AC8, GFP–AC8M1, GFP–AC8 D416N or Lyn-GFP; graphical representations of PDM values of colocalisation are shown in the right panels. (F) Colocalisation (Rr) analysis of E. (G) RatioPM/Cyt analysis of E.
Fig. 3.
Fig. 3.
The N-terminus of AC8 interacts with actin. (A) Fragments of AC8. (B) GST pull-downs of actin and CaM from cell lysates in the absence (100 μM EGTA) or presence of Ca2+ (10 μM), by fragments of AC8. (C) Densitometry from B (n=5–6). (D) Co-immunoprecipitation of actin in cells expressing AC8–HA or AC8M1–HA. (E) Densitometry of D, relative to input and normalized to untransfected HEK293 cells (n=5).
Fig. 4.
Fig. 4.
GFP–AC8 distribution and regulation depends on the intact cytoskeleton and PM cholesterol. (A) Cells expressing GFP–AC8 pre-treated with 2 μM LatB, 10 mM MβCD or 200 mU/ml SMase, and stained with phalloidin. (B) Images of internalized GFP–AC8 colocalising with phalloidin (indicated by arrows) following 2 μM LatB pre-treatment; graphical representations of PDM values of colocalisation are shown in the right panels. (C) RatioPM/Cyt analysis of A. (D) Single cell Epac2-camps detection of cAMP in GFP–AC8 cells pre-treated with 2 μM LatB, 10 mM MβCD or 200 mU/ml SMase, following CCE. The maximum cAMP response was induced by the addition of 10 μM FSK, 2 mM Ca2+, 100 μM IBMX and 10 μM isoproterenol. (E,F) FRET ratio following TG treatment (E) and in response to CCE (F).
Fig. 5.
Fig. 5.
The distribution and regulation of AC8 depends on its N-terminus, but not cAMP. (A) Cells expressing GFP–AC8M1, pre-treated with 2 μM LatB, 10 mM MβCD or 200 mU/ml SMase and stained with phalloidin. (B) RatioPM/Cyt analysis of A. (C) Single cell Epac2-camps detection of cAMP in GFP–AC8M1 cells pre-treated with 2 μM LatB, 10 mM MβCD or 200 mU/ml SMase. Following CCE the maximum cAMP response was induced by addition of 10 μM FSK, 4 mM Ca2+, 100 μM IBMX and 10 μM isoproterenol at 480 seconds. (D) FRET ratio of Epac2-camps in response to TG and CCE, from C. (E) Cells expressing GFP–AC8 D416N (GFP–AC8(D416N)) pre-treated with 2 μM LatB, 10 mM MβCD or 200 mU/ml SMase and stained with phalloidin. (F) RatioPM/Cyt analysis of E.
Fig. 6.
Fig. 6.
Ergosterol interacts with the N-terminus of AC8. Pre-bleach, post-bleach and FRET images for ETO and (A) GFP–AC8 and (B) GFP–AC8M1. Only the areas inside the red rectangle were subject to photobleaching. (C,D) Fluorescence intensity of ETO following bleaching of (C) GFP–AC8 and (D) GFP–AC8M1. (E) FRET efficiency between ETO and GFP–AC8 (n=28) and GFP–AC8M1 (n=32). Data are means ± standard deviation of at least five independent transfections with the AC constructs.
Fig. 7.
Fig. 7.
The N-terminus of AC8 defines its mobility. (A) Time-lapse series of a live cell expressing GFP–AC8. (B) Recovery curves of GFP–AC8, GFP–AC8M1 and GFP–AC8 D416N (GFP–AC8(D416N)) fluorescence intensities within the bleached membrane ROI (1.86 μm2). (C) MF of GFP–AC8, GFP–AC8M1 and GFP–AC8 D416N as determined by the YMAX of the recovery curves. (D) Image of GFP–AC8 cell 1 second post-bleach with the linear ROI (dashed line) across the bleached membrane to record intensities. (E) Representative Gaussian profiles from D for 20 seconds post-bleach (green, 1 second; blue, 20 seconds; red, 2–19 seconds post-bleach). (F) Example of the radius squared from E, where the goodness of fit (R2) is greater than 0.9. (G) DFRAP as determined by the slope of F. (H) DFCS of GFP–AC8, GFP–AC8M1 and GFP–AC8 D416N. (I) Particle number (μm−2) of GFP–AC8, GFP–AC8M1 and GFP–AC8 D416N. (J) Molecular brightness (ε, cpms, kHz) of GFP–AC8, GFP–AC8M1 and GFP–AC8 D416N.
Fig. 8.
Fig. 8.
Both the N-terminus of AC8 and cAMP production influences AC8 mobility. (A) Recovery curves of cells expressing GFP–AC8, GFP–AC8M1 or GFP–AC8 D416N (GFP–AC8(D416N)) and pre-treated with 2 μM LatB, 10 mM MβCD or 200 mU/ml SMase. (B) MF from A. (C) DFRAP from A of GFP–AC8, GFP–AC8M1 or GFP–AC8 D416N pre-treated with 2 μM LatB or 10 mM MβCD. (D) DFCS of GFP–AC8, GFP–AC8M1 or GFP–AC8 D416N pre-treated with 2 μM LatB or 10 mM MβCD. (E) Molecular brightness (ε, cpms, kHz) of GFP–AC8, GFP–AC8M1 and GFP–AC8 D416N. (F) Particle number (μm−2) of GFP–AC8, GFP–AC8M1 and GFP–AC8 D416N.
Fig. 9.
Fig. 9.
Representation of the actin cytoskeleton in the AC8 microdomain. (A) Depiction of the relative activities of AC8, partially active AC8M1 and inactive AC8 D416N (GFP–AC8(D416N)). (B) AC8, AC8M1 and AC8 D416N microdomains with respect to the cytoskeleton. In the intact cell, AC8 and AC8 D416N are tethered by the N-terminus to F-actin (blue spheres). AC8M1 lacks the N-terminus and is trapped in corrals. (C) Following disruption with LatB, the cAMP (black diamonds) produced by AC8 could promote protein–protein interactions (green and red shapes) and induce actin polymerization, forming slow moving aggregates, which can be measured by FRAP and bleached by FCS, and a fast moving, non-aggregated population. Disruption of the cytoskeleton leads to the free diffusion of AC8M1 and two populations of AC8 D416N are produced, both recordable by FRAP and FCS; fast diffusing individual proteins and slower moving proteins bound to small linear actin filaments. (D) Summary of FRAP and FCS data following treatment with LatB. Addition and subtraction signs represent an increase or decrease, respectively, compared with the untreated control.
Fig. 10.
Fig. 10.
cAMP influences the cytoskeleton through PKA and EPAC. (A,B) The effect of inhibiting PKA with 10 μM H89 or 1 μM KT5720 on (A) the MF of GFP–AC8 ± LatB and (B) DFRAP of GFP–AC8 ± LatB. (C,D) The effect of exogenous cAMP analogues, CPT–cAMP and DB–cAMP on (C) the MF of GFP–AC8 D416N ± LatB and (D) the DFRAP of GFP–AC8 D416N ± LatB. (E,F) The effect of LatB on the mobility of GFP–AC8 D416N when AC8–HA is also expressed on (E) the MF and (F) the DFRAP.

References

    1. Bacskai B. J., Hochner B., Mahaut-Smith M., Adams S. R., Kaang B. K., Kandel E. R., Tsien R. Y. (1993). Spatially resolved dynamics of cAMP and protein kinase A subunits in Aplysia sensory neurons. Science 260, 222-226 - PubMed
    1. Bauman A. L., Soughayer J., Nguyen B. T., Willoughby D., Carnegie G. K., Wong W., Hoshi N., Langeberg L. K., Cooper D. M. F., Dessauer C. W., et al. (2006). Dynamic regulation of cAMP synthesis through anchored PKA-adenylyl cyclase V/VI complexes. Mol. Cell 23, 925-931 - PMC - PubMed
    1. Boyajian C. L., Garritsen A., Cooper D. M. F. (1991). Bradykinin stimulates Ca2+ mobilization in NCB-20 cells leading to direct inhibition of adenylylcyclase. A novel mechanism for inhibition of cAMP production. J. Biol. Chem. 266, 4995-5003 - PubMed
    1. Briddon S. J., Middleton R. J., Cordeaux Y., Flavin F. M., Weinstein J. A., George M. W., Kellam B., Hill S. J. (2004). Quantitative analysis of the formation and diffusion of A1-adenosine receptor-antagonist complexes in single living cells. Proc. Natl. Acad. Sci. USA 101, 4673-4678 - PMC - PubMed
    1. Brown D. A., London E. (1998). Functions of lipid rafts in biological membranes. Ann. Rev. Cell Dev. Biol. 14, 111-136 - PubMed

Publication types

MeSH terms