

Total lung capacity by plethysmography and high-resolution computed tomography in COPD
- PMID: 22399851
- PMCID: PMC3292389
- DOI: 10.2147/COPD.S26419
Total lung capacity by plethysmography and high-resolution computed tomography in COPD
Abstract
Aim: To characterize and compare total lung capacity (TLC) measured by plethysmography with high-resolution computed tomography (HRCT), and to identify variables that predict the difference between the two modalities.
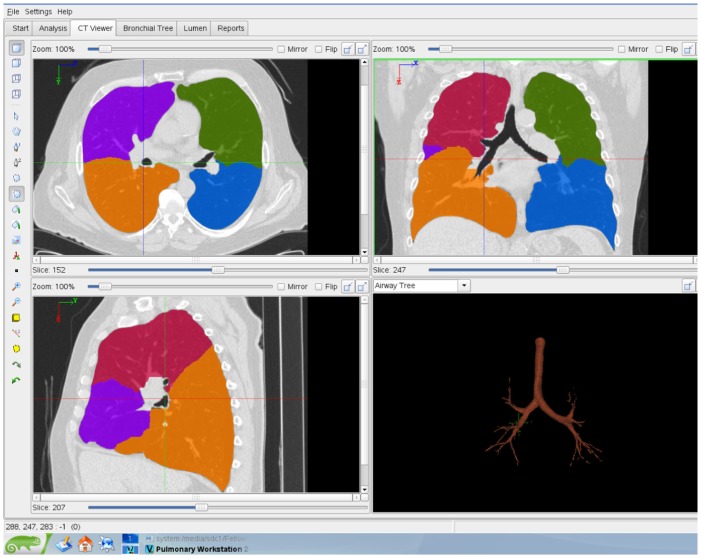
Methods: Fifty-nine consecutive patients referred for the evaluation of COPD were retrospectively reviewed. Patients underwent full pulmonary function testing and HRCT within 3 months. TLC was obtained by plethysmography as per American Thoracic Society/European Respiratory Society standards and by HRCT using custom software on 0.75 and 5 mm thick contiguous slices performed at full inspiration (TLC).
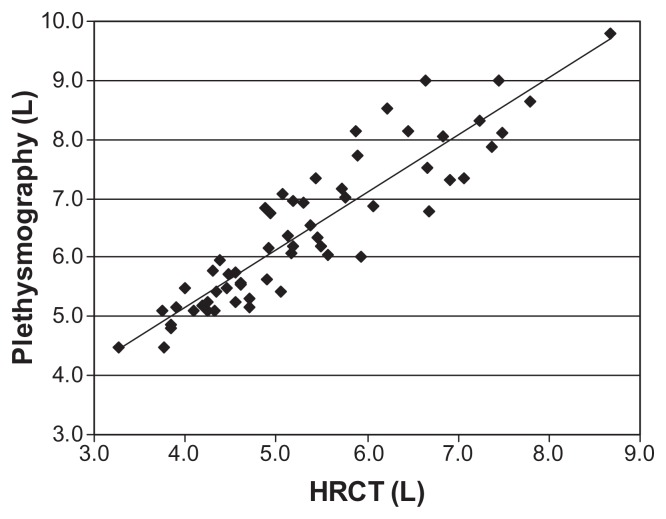
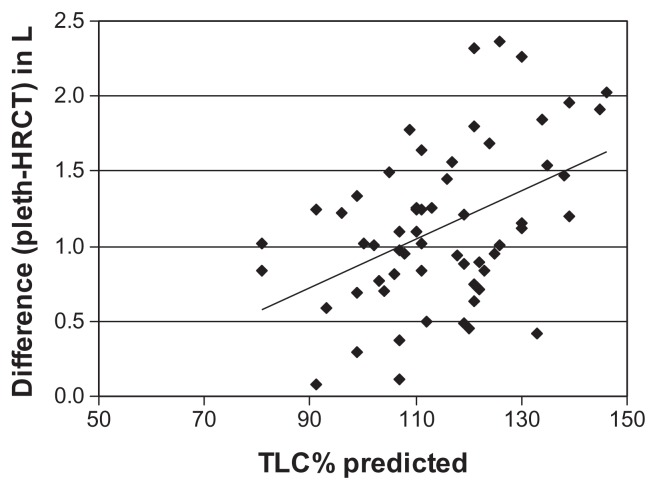
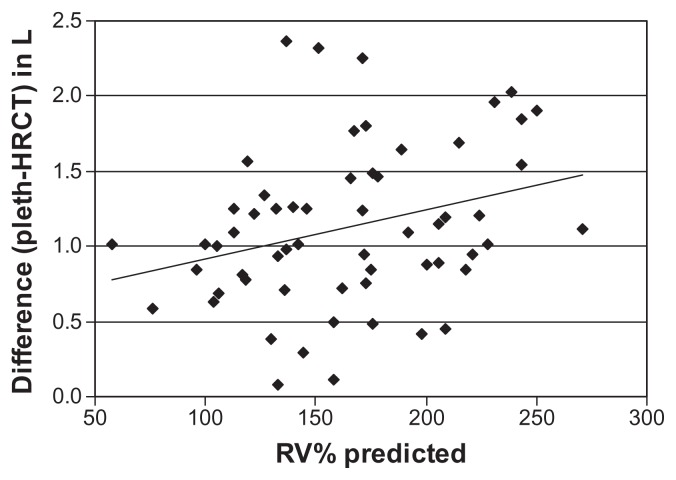
Results: TLC measured by plethysmography correlated with TLC measured by inspiratory HRCT (r = 0.92, P < 0.01). TLC measured by plethysmography was larger than that determined by inspiratory HRCT in most patients (mean of 6.46 ± 1.28 L and 5.34 ± 1.20 L respectively, P < 0.05). TLC measured by both plethysmography and HRCT correlated significantly with indices of airflow obstruction (forced expiratory volume in 1 second/forced vital capacity [FVC] and FVC%), static lung volumes (residual volume, percent predicted [RV%], total lung capacity, percent predicted [TLC%], functional residual capacity, percent predicted [FRC%], and inspiratory capacity, percent predicted), and percent emphysema. TLC by plethysmography and HRCT both demonstrated significant inverse correlations with diffusion impairment. The absolute difference between TLC measured by plethysmography and HRCT increased as RV%, TLC%, and FRC% increased. Gas trapping (RV% and FRC%) independently predicted the difference in TLC between plethysmography and HRCT.
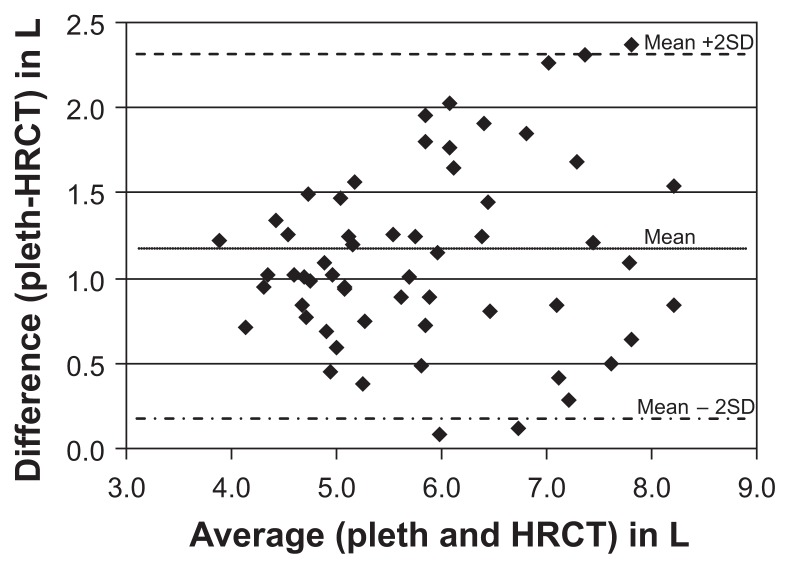
Conclusion: In COPD, TLC by plethysmography can be up to 2 L greater than inspiratory HRCT. Gas trapping independently predicts patients for whom TLC by plethysmography differs significantly from HRCT.
Keywords: gas trapping; high-resolution computed tomography; lung capacity; lung volume measurement errors; plethysmography.
Figures
References
-
- Pellegrino R, Viegi G, Brusasco V, et al. Interpretative strategies for lung function tests. Eur Respir J. 2005;26(5):948–968. - PubMed
-
- Coxson HO, Nasute Fauerbach PV, Storness-Bliss C, et al. Computed tomography assessment of lung volume changes after bronchial valve treatment. Eur Respir J. 2008;32(6):1443–1450. - PubMed
-
- Gierada DS, Hakimian S, Slone RM, Yusen RD. MR analysis of lung volume and thoracic dimensions in patients with emphysema before and after lung volume reduction surgery. AJR Am J Roentgenol. 1998;170(3):707–714. - PubMed
-
- Zaporozhan J, Ley S, Eberhardt R, et al. Paired inspiratory/expiratory volumetric thin-slice CT scan for emphysema analysis: Comparison of different quantitative evaluations and pulmonary function test. Chest. 2005;128(5):3212–3220. - PubMed
-
- Orens JB, Estenne M, Arcasoy S, et al. International guidelines for the selection of lung transplant candidates: 2006 update – a consensus report from the Pulmonary Scientific Council of the International Society for Heart and Lung Transplantation. J Heart Lung Transplant. 2006;25(7):745–755. - PubMed
