

Can transthoracic echocardiography be used to predict fluid responsiveness in the critically ill patient? A systematic review
- PMID: 22400109
- PMCID: PMC3286892
- DOI: 10.1155/2012/513480
Can transthoracic echocardiography be used to predict fluid responsiveness in the critically ill patient? A systematic review
Abstract
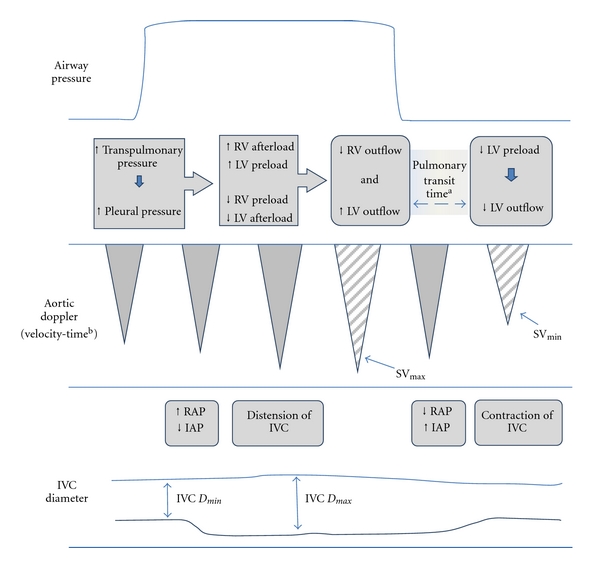
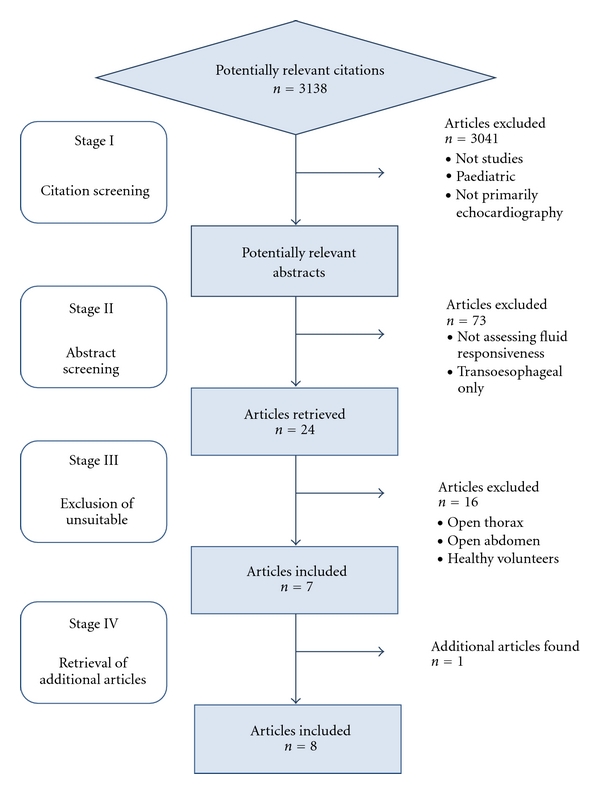
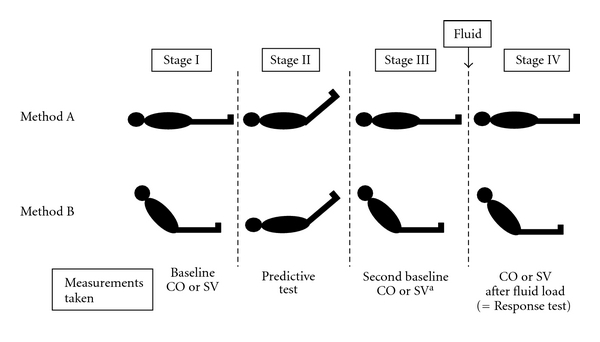
Introduction. We systematically evaluated the use of transthoracic echocardiography in the assessment of dynamic markers of preload to predict fluid responsiveness in the critically ill adult patient. Methods. Studies in the critically ill using transthoracic echocardiography (TTE) to predict a response in stroke volume or cardiac output to a fluid load were selected. Selection was limited to English language and adult patients. Studies on patients with an open thorax or abdomen were excluded. Results. The predictive power of diagnostic accuracy of inferior vena cava diameter and transaortic Doppler signal changes with the respiratory cycle or passive leg raising in mechanically ventilated patients was strong throughout the articles reviewed. Limitations of the technique relate to patient tolerance of the procedure, adequacy of acoustic windows, and operator skill. Conclusions. Transthoracic echocardiographic techniques accurately predict fluid responsiveness in critically ill patients. Discriminative power is not affected by the technique selected.
Figures
References
-
- Wiedemann HP, Wheeler AP, Bernard GR, et al. Comparison of two fluid-management strategies in acute lung injury. The New England Journal of Medicine. 2006;354(24):2564–2575. - PubMed
-
- Kircher BJ, Himelman RB, Schiller NB. Noninvasive estimation of right atrial pressure from the inspiratory collapse of the inferior vena cava. American Journal of Cardiology. 1990;66(4):493–496. - PubMed
-
- Bigatello LM, Kistler EB, Noto A. Limitations of volumetric indices obtained by transthoracic thermodilution. Minerva Anestesiologica. 2010;76(11):945–949. - PubMed
-
- Harvey S, Harrison DA, Singer M, et al. Assessment of the clinical effectiveness of pulmonary artery catheters in management of patients in intensive care (PAC-Man): a randomised controlled trial. The Lancet. 2005;366(9484):472–477. - PubMed
-
- Michard F. Stroke volume variation: from applied physiology to improved outcomes. Critical Care Medicine. 2011;39(2):402–403. - PubMed
LinkOut - more resources
Full Text Sources
