

Improved mass defect model for theoretical tryptic peptides
- PMID: 22401145
- PMCID: PMC3312599
- DOI: 10.1021/ac203255e
Improved mass defect model for theoretical tryptic peptides
Abstract
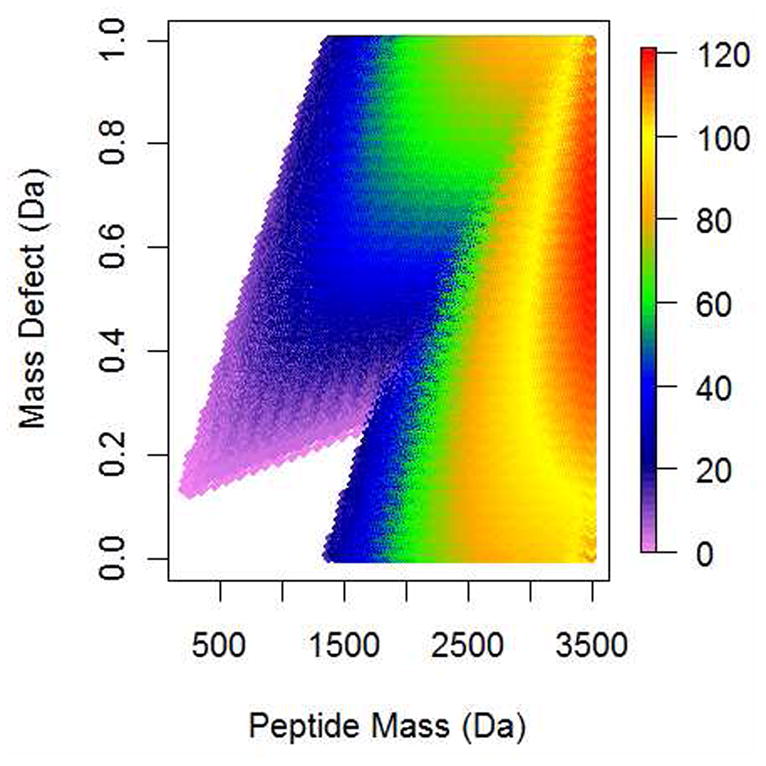
Improvements in the mass accuracy and resolution of mass spectrometers have greatly aided mass spectrometry-based proteomics in profiling complex biological mixtures. With the use of innovative bioinformatics approaches, high mass accuracy and resolution information can be used for filtering chemical noise in mass spectral data. Using our recent algorithmic developments, we have generated the mass distributions of all theoretical tryptic peptides composed of 20 natural amino acids and with masses limited to 3.5 kDa. Peptide masses are distributed discretely, with well-defined peak clusters separated by empty or sparsely populated trough regions. Accurate models for peak centers and widths can be used to filter peptide signals from chemical noise. We modeled mass defects, the difference between monoisotopic and nominal masses, and peak centers and widths in the peptide mass distributions. We found that peak widths encompassing 95% of all peptide sequences are substantially smaller than previously thought. The result has implications for filtering out larger stretches of the mass axis. Mass defects of peptides exhibit an oscillatory behavior which is damped at high mass values. The periodicity of the oscillations is about 14 Da which is the most common difference between the masses of the 20 natural amino acids. To determine the effects of amino acid modifications on our findings, we examined the mass distributions of peptides composed of the 20 natural amino acids, oxidized Met, and phosphorylated Ser, Thr, and Tyr. We found that extension of the amino acid set by modifications increases the 95% peak width. Mass defects decrease, reflecting the fact that the average mass defect of natural amino acids is larger than that of oxidized Met. We propose that a new model for mass defects and peak widths of peptides may improve peptide identifications by filtering chemical noise in mass spectral data.
Figures


Similar articles
-
Use of theoretical peptide distributions in phosphoproteome analysis.J Proteome Res. 2013 Jul 5;12(7):3207-14. doi: 10.1021/pr4003382. Epub 2013 Jun 19. J Proteome Res. 2013. PMID: 23731183 Free PMC article.
-
Liquid chromatographic-high-resolution mass spectrometric and tandem mass spectrometric identification of synthetic peptides using electrospray ionization.J Chromatogr A. 1998 Mar 20;800(1):89-100. doi: 10.1016/s0021-9673(97)01104-7. J Chromatogr A. 1998. PMID: 9561756
-
Periodicity of monoisotopic mass isomers and isobars in proteomics.Anal Chem. 2011 Oct 15;83(20):8019-23. doi: 10.1021/ac201624t. Epub 2011 Sep 20. Anal Chem. 2011. PMID: 21932815
-
Current algorithmic solutions for peptide-based proteomics data generation and identification.Curr Opin Biotechnol. 2013 Feb;24(1):31-8. doi: 10.1016/j.copbio.2012.10.013. Epub 2012 Nov 8. Curr Opin Biotechnol. 2013. PMID: 23142544 Free PMC article. Review.
-
New Tricks for an Old Dog: Proteomics of the PSD.In: Kittler JT, Moss SJ, editors. The Dynamic Synapse: Molecular Methods in Ionotropic Receptor Biology. Boca Raton (FL): CRC Press/Taylor & Francis; 2006. Chapter 3. In: Kittler JT, Moss SJ, editors. The Dynamic Synapse: Molecular Methods in Ionotropic Receptor Biology. Boca Raton (FL): CRC Press/Taylor & Francis; 2006. Chapter 3. PMID: 21204470 Free Books & Documents. Review.
Cited by
-
Using SEQUEST with theoretically complete sequence databases.J Am Soc Mass Spectrom. 2015 Nov;26(11):1858-64. doi: 10.1007/s13361-015-1228-5. Epub 2015 Aug 4. J Am Soc Mass Spectrom. 2015. PMID: 26238326 Free PMC article.
-
Towards automated discrimination of lipids versus peptides from full scan mass spectra.EuPA Open Proteom. 2014 Sep 1;4:87-100. doi: 10.1016/j.euprot.2014.05.002. EuPA Open Proteom. 2014. PMID: 25414814 Free PMC article.
-
Simplifying MS1 and MS2 spectra to achieve lower mass error, more dynamic range, and higher peptide identification confidence on the Bruker timsTOF Pro.PLoS One. 2022 Jul 7;17(7):e0271025. doi: 10.1371/journal.pone.0271025. eCollection 2022. PLoS One. 2022. PMID: 35797390 Free PMC article.
-
Use of theoretical peptide distributions in phosphoproteome analysis.J Proteome Res. 2013 Jul 5;12(7):3207-14. doi: 10.1021/pr4003382. Epub 2013 Jun 19. J Proteome Res. 2013. PMID: 23731183 Free PMC article.
-
A flexible statistical model for alignment of label-free proteomics data--incorporating ion mobility and product ion information.BMC Bioinformatics. 2013 Dec 16;14:364. doi: 10.1186/1471-2105-14-364. BMC Bioinformatics. 2013. PMID: 24341404 Free PMC article.
References
-
- Domon B, Aebersold R. Mass spectrometry and protein analysis. Science. 2006;312:212–17. - PubMed
-
- Makarov A, Denisov E, Lange O, Horning S. Dynamic range of mass accuracy in LTQ Orbitrap hybrid mass spectrometer. J Am Soc Mass Spectrom. 2006;17:977–82. - PubMed
-
- Yu L, Xiong YM, Polfer NC. Periodicity of monoisotopic mass isomers and isobars in proteomics. Anal Chem. 2011;83:8019–23. - PubMed
Publication types
MeSH terms
Substances
Grants and funding
LinkOut - more resources
Full Text Sources
Other Literature Sources
Miscellaneous
