Assessing toddlers' speech-sound discrimination
- PMID: 22402014
- PMCID: PMC3335986
- DOI: 10.1016/j.ijporl.2012.02.020
Assessing toddlers' speech-sound discrimination
Abstract
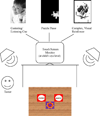
Objective: Valid and reliable methods for assessing speech perception in toddlers are lacking in the field, leading to conspicuous gaps in understanding how speech perception develops and limited clinical tools for assessing sensory aid benefit in toddlers. The objective of this investigation was to evaluate speech-sound discrimination in toddlers using modifications to the Change/No-Change procedure [1].
Methods: Normal-hearing 2- and 3-year-olds' discrimination of acoustically dissimilar ("easy") and similar ("hard") speech-sound contrasts were evaluated in a combined repeated measures and factorial design. Performance was measured in d'. Effects of contrast difficulty and age were examined, as was test-retest reliability, using repeated measures ANOVAs, planned post hoc tests, and correlation analyses.
Results: The easy contrast (M=2.53) was discriminated better than the hard contrast (M=1.72) across all ages (p<.0001). The oldest group of children (M=3.13) discriminated the contrasts better than youngest (M=1.04; p<.0001) and the mid-age children (M=2.20; p=.037), who in turn discriminated the contrasts better than the youngest children (p=.010). Test-retest reliability was excellent (r=.886, p<.0001). Almost 90% of the children met the teaching criterion. The vast majority demonstrated the ability to be tested with the modified procedure and discriminated the contrasts. The few who did not were 2.5 years of age and younger.
Conclusions: The modifications implemented resulted, at least preliminarily, in a procedure that is reliable and sensitive to contrast difficulty and age in this young group of children, suggesting that these modifications are appropriate for this age group. With further development, the procedure holds promise for use in clinical populations who are believed to have core deficits in rapid phonological encoding, such as children with hearing loss or specific language impairment, children who are struggling to read, and second-language learners.
Copyright © 2012 Elsevier Ireland Ltd. All rights reserved.
Figures


Similar articles
-
The Persian version of auditory word discrimination test (P-AWDT) for children: Development, validity, and reliability.Int J Pediatr Otorhinolaryngol. 2018 Jul;110:93-99. doi: 10.1016/j.ijporl.2018.05.003. Epub 2018 May 5. Int J Pediatr Otorhinolaryngol. 2018. PMID: 29859596
-
The MAndarin spoken word-Picture IDentification test in noise-Adaptive (MAPID-A) measures subtle speech-recognition-in-noise changes and spatial release from masking in very young children.PLoS One. 2019 Jan 10;14(1):e0209768. doi: 10.1371/journal.pone.0209768. eCollection 2019. PLoS One. 2019. PMID: 30629627 Free PMC article.
-
A modification of play audiometry to assess speech discrimination ability in severe-profoundly deaf 2- to 4-year-old children.Ear Hear. 1998 Oct;19(5):371-84. doi: 10.1097/00003446-199810000-00004. Ear Hear. 1998. PMID: 9796646
-
Closed-Set Speech Discrimination Tests for Assessing Young Children.Ear Hear. 2018 Jan/Feb;39(1):32-41. doi: 10.1097/AUD.0000000000000528. Ear Hear. 2018. PMID: 29189292
-
A systematic review of acoustic change complex (ACC) measurements and applicability in children for the assessment of the neural capacity for sound and speech discrimination.Hear Res. 2024 Sep 15;451:109090. doi: 10.1016/j.heares.2024.109090. Epub 2024 Jul 17. Hear Res. 2024. PMID: 39047579
Cited by
-
Audiovisual speech perception development at varying levels of perceptual processing.J Acoust Soc Am. 2016 Apr;139(4):1713. doi: 10.1121/1.4945590. J Acoust Soc Am. 2016. PMID: 27106318 Free PMC article.
-
Cognitive and linguistic sources of variance in 2-year-olds’ speech-sound discrimination: a preliminary investigation.J Speech Lang Hear Res. 2014 Feb;57(1):308-26. doi: 10.1044/1092-4388(2013/12-0227). J Speech Lang Hear Res. 2014. PMID: 24023371 Free PMC article. Clinical Trial.
-
Preschoolers benefit from visually salient speech cues.J Speech Lang Hear Res. 2015 Feb;58(1):135-50. doi: 10.1044/2014_JSLHR-H-13-0343. J Speech Lang Hear Res. 2015. PMID: 25322336 Free PMC article.
-
Interrater Reliability for a Two-Interval, Observer-Based Procedure for Measuring Hearing in Young Children.Am J Audiol. 2020 Dec 9;29(4):762-773. doi: 10.1044/2020_AJA-20-00022. Epub 2020 Sep 23. Am J Audiol. 2020. PMID: 32966098 Free PMC article.
-
Behavioral Assessment of Hearing in 2- to 7-Year-Old Children: Evaluation of a Two-Interval, Observer-Based Procedure Using Conditioned Play-Based Responses.Am J Audiol. 2019 Sep 13;28(3):560-571. doi: 10.1044/2019_AJA-19-0004. Epub 2019 Jun 25. Am J Audiol. 2019. PMID: 31238003 Free PMC article.
References
-
- Sussman JE, Carney AE. Effects of transition length on the perception of stop consonants by children and adults. J Speech Hear Res. 1989;36:380–395. - PubMed
-
- Carney AE, Moeller MP. Treatment efficacy: hearing loss in children. J Speech Lang Hear Res. 1998;41:S61–S84. - PubMed
-
- Moeller MP, Hoover B, Putman C, Arbataitis K, Bohnenkamp G, Peterson B, et al. Vocalizations of infants with hearing loss compared with infants with normal hearing: Part I – phonetic development. Ear Hear. 2007;28:605–627. - PubMed
-
- Moeller MP, Hoover B, Putman C, Arbataitis K, Bohnenkamp G, Peterson B, et al. Vocalizations of infants with hearing loss compared with infants with normal hearing: part II – transition to words. Ear Hear. 2007;28:628–642. - PubMed
-
- Walley AC. Speech perception in childhood. In: Pisoni DB, Remez RE, editors. The Handbook of Speech Perception. Malden: Blackwell Publishing; 2005. pp. 449–468.
Publication types
MeSH terms
Grants and funding
LinkOut - more resources
Full Text Sources
Miscellaneous

