Comparative Study
. 2012 May;32(5):1167-77.
doi: 10.1161/ATVBAHA.112.247668. Epub 2012 Mar 8.

The mechanisms of cerebral vascular dysfunction and neuroinflammation by MMP-mediated degradation of VEGFR-2 in alcohol ingestion

Affiliations
Comparative Study

The mechanisms of cerebral vascular dysfunction and neuroinflammation by MMP-mediated degradation of VEGFR-2 in alcohol ingestion

P M Abdul Muneer et al. Arterioscler Thromb Vasc Biol. 2012 May.

Abstract

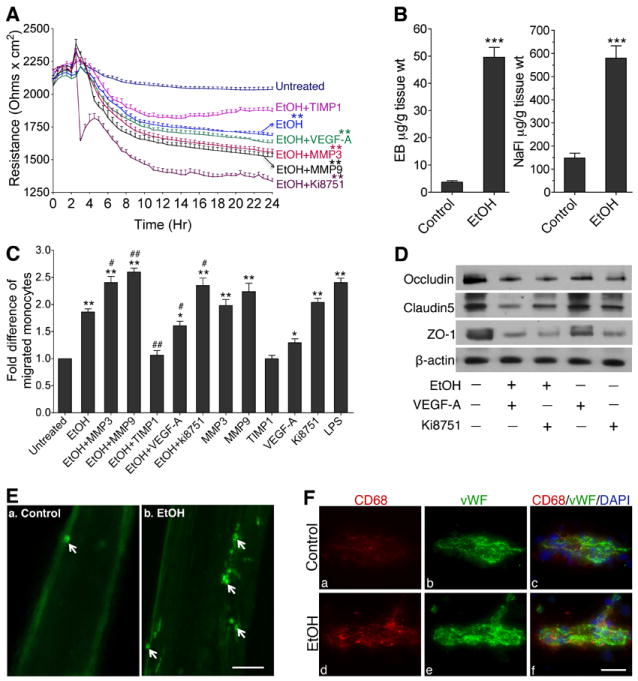
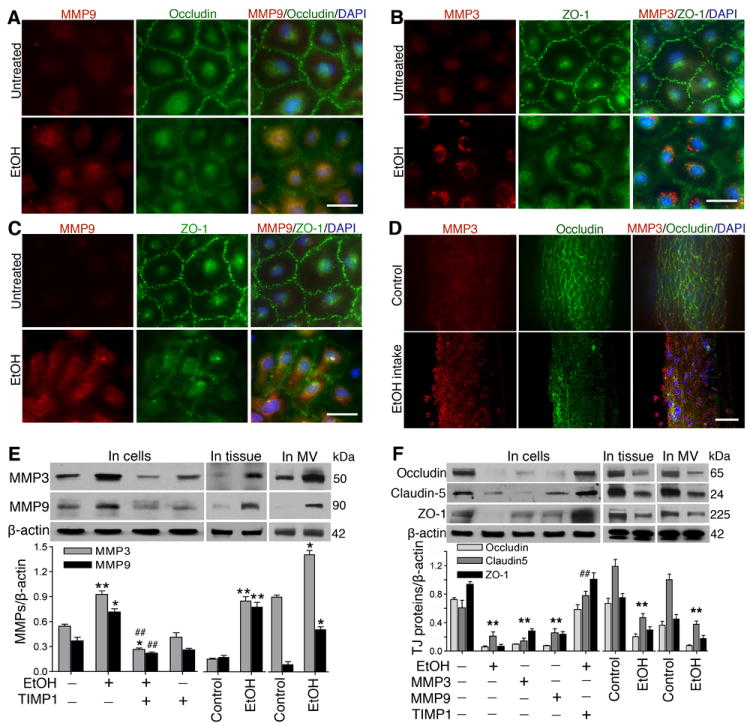
Objective: Blood-brain barrier (BBB) dysfunction caused by activation of matrix metalloproteinases (MMPs) is a pathological feature in vascular/neurological disease. We describe the mechanisms of BBB dysfunction and neuroinflammation as a result of MMP-3/9 activation and disruption of vascular endothelial growth factor (VEGF)-A/VEGFR-2 interaction, impairing effective angiogenesis.

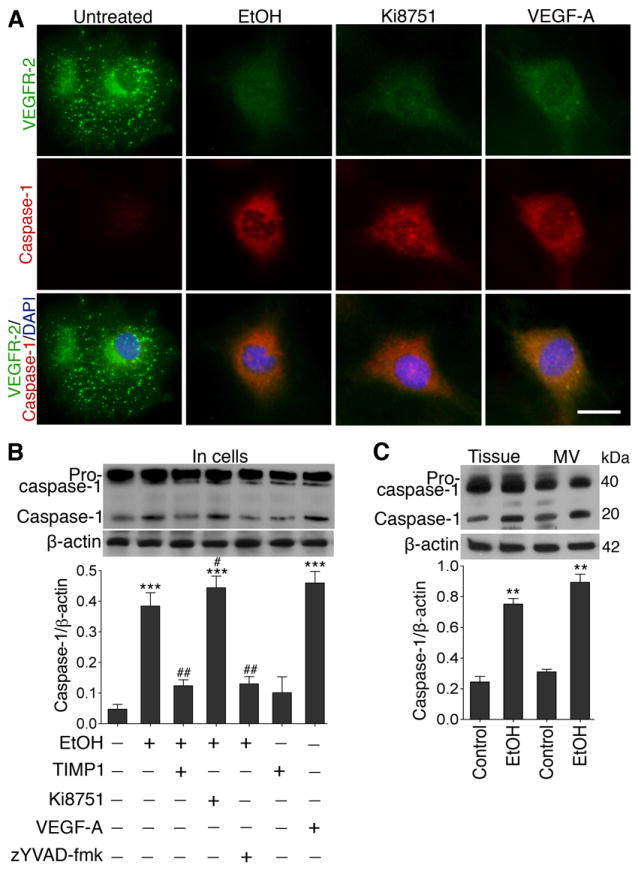
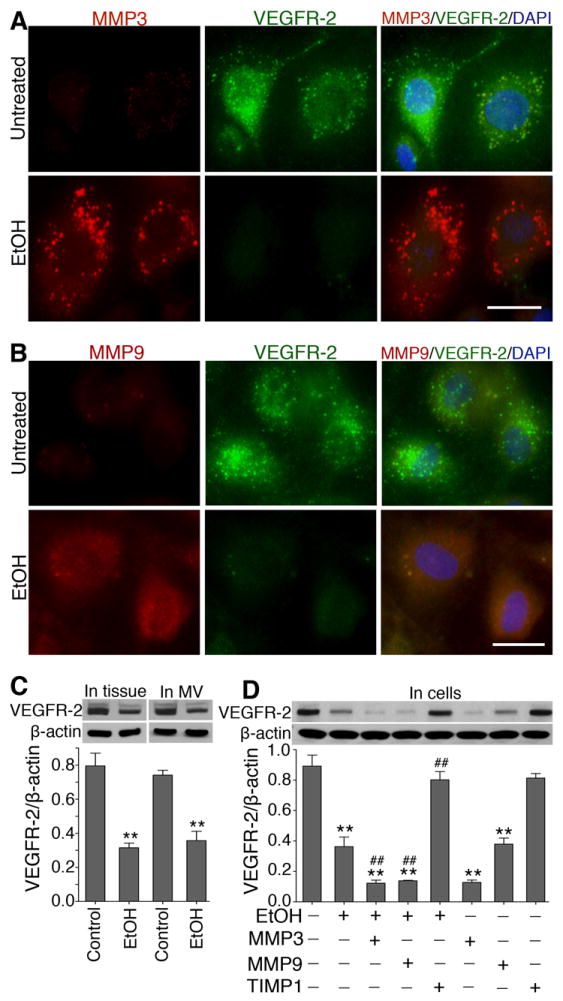
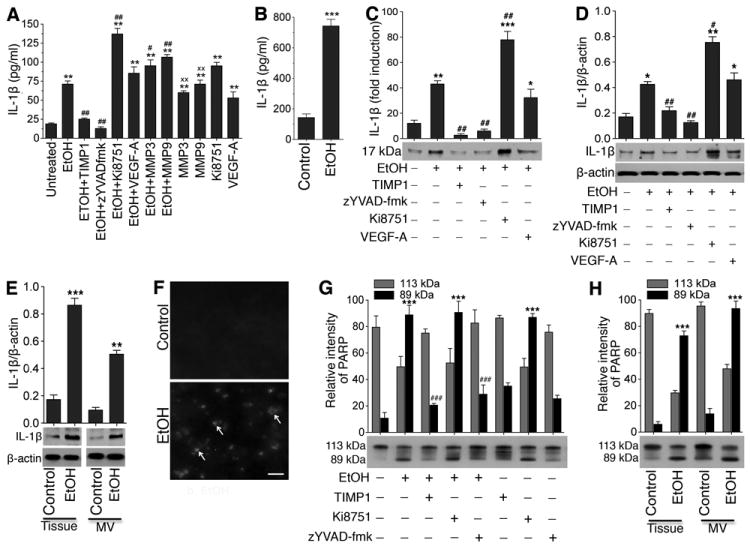
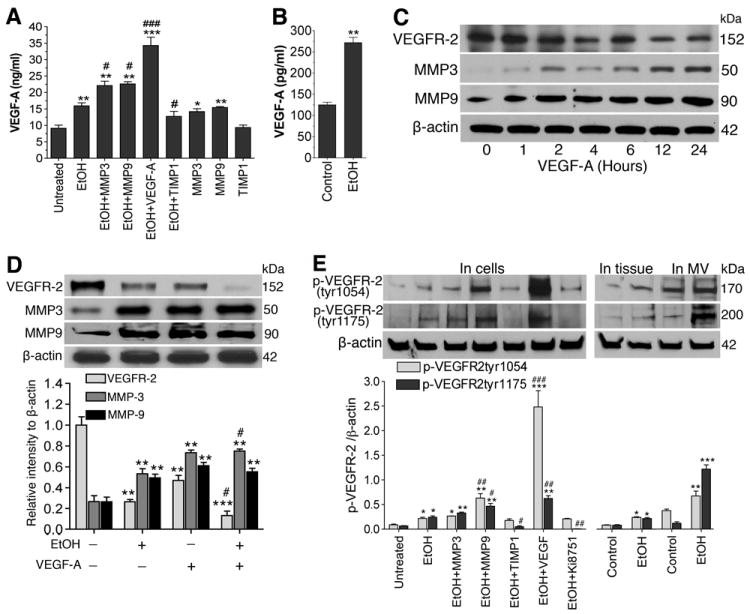
Methods and results: We investigate the hypothesis in human brain endothelial cells and animal model of chronic alcohol ingestion. Proteome array analysis, zymography, immunofluorescence, and Western blotting techniques detected the activation, expression, and levels of MMP-3 and MMP-9. We found that degradation of VEGFR-2 and BBB proteins, for example, occludin, claudin-5, and ZO-1 by MMP-3/9, causes rupture of capillary endothelium and BBB leakiness. Impairment of BBB integrity was demonstrated by increased permeability of dye tracers and Fluo-3/calcein-AM-labeled monocyte adhesion or infiltration and decrease in transendothelial electric resistance. Alcohol-induced degradation of endothelial VEGFR-2 by MMP-3/9 led to a subsequent elevation of cellular/serum VEGF-A level. The decrease in VEGFR-2 with subsequent increase in VEGF-A level led to apoptosis and neuroinflammation via the activation of caspase-1 and IL-1β release. The use of MMPs, VEGFR-2, and caspase-1 inhibitors helped to dissect the underlying mechanisms.

Conclusions: Alcohol-induced MMPs activation is a key mechanism for dysfunction of BBB via degradation of VEGFR-2 protein and activation of caspase-1 or IL-1β release. Targeting VEGF-induced MMP-3/9 activation can be a novel preventive approach to vascular inflammatory disease in alcohol abuse.


Figures

Figure 1
Figure 1. Activation of MMPs by ethanol degrade TJ proteins
A-D, Immunofluorescent staining of (A) MMP-9 (red), occludin (green), and DAPI (blue), (B) MMP-3 (red), ZO-1 (green), and DAPI (blue), (C) MMP-9 (red), ZO-1 (green), and DAPI (blue) in hBECs, and (D) MMP-3 (red), occludin (green), DAPI (blue) in intact brain microvessels of rat. E-F, Western blot analyses of MMP-3, MMP-9, and actin; Occludin, Claudin-5, ZO-1 and actin in hBEC lysate protein, whole brain tissue homogenates, and in protein extract from isolated microvessels. For all hBECs culture work, cells were treated with or without EtOH (50 mM) in the presence or absence of MMP-3 or MMP-9 (100 ng/mL each) or TIMP1 (100 ng/mL) for 24 hr. Bar graphs show the results that are expressed as ratio of MMP-3/9, occludin, claudin-5 or ZO-1 to that of β-actin bands. Values are mean ±SEM; n=4. *p<0.05; **p<0.01 vs control in E and F; ##p<0.01 vs EtOH in E or MMP-3/9 in F. Scale bar = 40 μm in A, B and C and 5 μm in D.
Figure 2
Figure 2. Activation of MMP-3/9 causes BBB leakiness
A, Kinetic profile of the trans-endothelial electrical resistance (TEER) across the BBB following EtOH, MMP-3/9, TIMP1, VEGF-A or Ki8751 treatment. After maintaining a stable resistance for 2 hr, TEER was monitored at 400 Hz with 10 min intervals. Reproducible results were obtained in 3 individual experiments. B, In vivo permeability of Evans Blue (EB, 5 μM) and Sodium fluorescein (Na-Fl, 5 μM) across the BBB (n=5). C, Migration of monocytes across the in vitro model of BBB after treatment of various test compounds as shown in figure. Data are expressed as fold difference from untreated cells. D, Effects of EtOH (50 mM), VEGF-A (100 ng/mL), Ki8751 (10 μM), EtOH+VEGF-A or EtOH+Ki8751 on occludin, claudin-5 and ZO-1 levels in hBECs after 24 hr exposure (Western blotting). E, Fluo-3 labeled macrophage adhesion/migration in brain capillary following infusion of cells into the common carotid artery. F, Immunofluorescent staining of CD68 (green) and von Willibrand factor (green) merged with DAPI (blue) in microvessel of brain tissue section. Scale bar indicates 5 μm in all panels. *p<0.05; **p<0.01 vs untreated or control in A, B and C; #p<0.05; ##p<0.01 vs EtOH (second bar) in C.
Figure 3
Figure 3. Alcohol-induced activation of MMPs degrades VEGFR-2 protein
A-B, Immunofluorescent staining of (A) MMP-3 (red), VEGFR-2 (green), and DAPI (blue); (B) MMP-9 (red), VEGFR-2 (green), and DAPI (blue) in hBECs with or without exposure to 50 mM EtOH for 24 hr. Scale bar indicates 20 μm in all panels. C, Western blot analysis of VEGFR-2 protein in cortical brain tissue homogenates and brain microvessel protein. D, Western blot analysis of VEGFR-2 protein in hBEC lysate proteins following exposure to respective test compounds for 24 hr. Bar graphs show the results that are expressed as ratio of VEGFR-2 to that of β-actin bands, and values are mean ±SEM; n=4. **p<0.01 vs untreated or control in C and D; ##p<0.01 vs EtOH (second bar) in D.
Figure 4
Figure 4. Degradation of VEGFR-2 causes elevation of VEGF-A levels
A-B, ELISA shows the levels of VEGF-A in: (A) hBEC cell culture supernatants in different treatment conditions, (B) blood serum. C, Western blot analysis of alterations in VEGFR-2, MMP-3 and MMP-9 protein levels after treatment of hBECs with VEGF-A (100 ng/mL) at different time points. D, Changes in protein levels of VEGFR-2, MMP-3 and MMP-9 after treatment of hBECs with EtOH (50 mM), or VEGF-A, or in combination for 24 hr. E, Western blot analysis for the changes in protein levels of phosphorylated VEGFR-2 (at tyr1054 and tyr1175) after treatment of hBECs in different treatment conditions for 24 hour as shown and in EtOH treated rat brain tissue and microvessels lysates. Results are expressed as ratio of VEGFR-2 or MMP-3/9 to that of β-actin in D and p-VEGFR-2tyr1054 or p-VEGFR-2tyr1175 to that of β-actin bands in E. Values are mean ±SEM, n=3 to 5 in all experiments. *p<0.05; **p<0.01 vs untreated or control in A and B; ##p<0.05; ##p<0.01; ###p<0.001 vs EtOH (second bar) in A and E.
Figure 5
Figure 5. Elevation of VEGF-A by alcohol activates caspase-1
A, Changes in the expression of VEGFR-2 (green), caspase-1 (red), DAPI (blue) in hBECs after exposure to EtOH (50 mM), Ki8751 (10 μM) and VEGF-A (100 ng/mL) for 24 hr. Scale bar =20 μm. B-C, Immunoblot analysis to show the alterations in caspase-1 protein levels in: (B) hBECs culture following treatment with respective test compounds, and (C) brain cortical tissue and microvessel homogenates protein. Bar graphs show the results, which are expressed as ratio of caspase-1 to that of β-actin bands. Values are mean ±SEM; n=4 to 5. **p<0.01; ***p<0.001 vs untreated or control in B and C; #p<0.05; ##p<0.01 vs EtOH (second bar) in B.
Figure 6
Figure 6. Activation of caspase-1 matures IL-1β and causes neuroinflammation and cell apoptosis
A-B, ELISA assay of IL-1β levels in: (A) hBEC culture supernatants of different treatment conditions, and (B) blood serum (100 μL of serum was used per well) of control and chronic alcohol intake rats. C-E, Western blot analyses of IL-1β protein levels in: (C) hBEC culture supernatants expressed as fold induction of IL-1β protein levels, (D) hBEC lysate protein, and (E) whole brain tissue and microvessel homogenates protein Bar graphs show the fold induction of expression of IL-1β in different treatments in C; ratio of expression of IL-1β to that of β-actin bands in D and E. F, TUNEL staining in rat brain cortical tissue section. The arrow indicates the TUNEL-positive cells. Scale bar =40 μm. G-H, Changes in PARP protein levels by Western blotting using anti-PARP antibody in: (G) hBEC lysate and (H) whole brain cortical tissue or microvessel tissue homogenates. Bar graphs data show the changes in arbitrary relative intensity of 113 kDa and 89 kDa fragments of PARP in cell culture and brain tissue samples. Values are mean ±SEM; n=3 to 4. **p<0.01; ***p<0.001 vs untreated or control in C, D and E; ##p<0.01 vs EtOH (second bar) in C and D. ***p<0.001 vs respective fragment in G and H.

Similar articles

Cited by

References

    1. Rubin LL, Staddon JM. The cell biology of the blood-brain barrier. Annu Rev Neurosci. 1999;22:11–28. - PubMed
    1. Hawkins BT, Davis TP. The blood-brain barrier/neurovascular unit in health and disease. Pharmacol Rev. 2005;57:173–185. - PubMed
    1. Fanning AS, Jameson BJ, Jesaitis LA, Anderson JM. The tight junction protein ZO-1 establishes a link between the transmembrane protein occludin and the actin cytoskeleton. J Biol Chem. 1998;273:29745–29753. - PubMed
    1. Wardlaw JM, Doubal F, Armitage P, Chappell F, Carpenter T, Munoz Maniega S, Farrall A, Sudlow C, Dennis M, Dhillon B. Lacunar stroke is associated with diffuse blood-brain barrier dysfunction. Ann Neurol. 2009;65:194–202. - PubMed
    1. Fiala M, Liu QN, Sayre J, Pop V, Brahmandam V, Graves MC, Vinters HV. Cyclooxygenase-2-positive macrophages infiltrate the Alzheimer’s disease brain and damage the blood-brain barrier. Eur J Clin Invest. 2002;32:360–371. - PubMed

Publication types

MeSH terms

Substances