

A semi-empirical model for the therapeutic range shift estimation caused by inhomogeneities in proton beam therapy
- PMID: 22402381
- PMCID: PMC5716409
- DOI: 10.1120/jacmp.v13i2.3631
A semi-empirical model for the therapeutic range shift estimation caused by inhomogeneities in proton beam therapy
Abstract
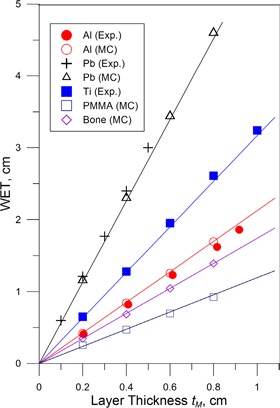
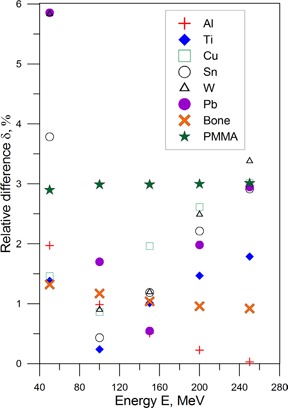
The purpose of this study was to devise a simple semi-empirical model to estimate the range shift in clinical practices with high-Z inhomogeneity in proton beam. A semi-empirical model utilizing the logarithmic dependence on Z in stopping power from Bohr's classical approach has been developed to calculate the range shift due to the presence of inhomogeneity. Range shift from metallic plates of atomic number Z of various thicknesses were measured in water using a parallel plate ionization chamber and calculated with the FLUKA Monte Carlo code. The proton range shifts for bone and polymethyl methacrylate (PMMA) were estimated using the semi-empirical model and compared with Monte Carlo calculation. The semi-empirical equation to determine range shift and water equivalent thickness is presented. The model predicts a shift of the therapeutic range to within 2.5% accuracy for initial proton energies of 50 to 250 MeV and atomic numbers from 3.3 (effective Z for water) to 82. This equation is independent of beam energy, and thus provides range shift from high-Z materials without the knowledge of proton energy. The proposed method of calculating the therapeutic range shift accurately requires only knowledge of the effective or actual atomic number of the inhomogeneity and the thickness of the inhomogeneity along the beam direction. The model generalizes the range shift calculation for any material based on its effective atomic number, and permits reliable prediction of the range shift for material combinations where no data is currently available. The proposed model can be readily implemented in routine clinical practice for proton range shift estimation and quality assurance on the treatment planning.
Figures


References
-
- Bragg WH, Kleeman R. LXXIV. On the ionization curves of radium. Philos Mag S6. 1904; 8 (48): 726–38.
-
- Urie M, Goitein M, Wagner M. Compensating for heterogeneities in proton radiation therapy. Phys Med Biol. 1984; 29 (5): 553–66. - PubMed
-
- Herrmann R, Carl J, Jakel O, Bassler N, Petersen JB. Investigation of the dosimetric impact of a Ni‐Ti fiducial marker in carbon ion and proton beams. Acta Oncol. 2010; 49 (7): 1160–64. - PubMed
-
- Cheung J, Kudchadker RJ, Zhu XR, Lee AK, Newhauser WD. Dose perturbations and image artifacts caused by carbon‐coated ceramic and stainless steel fiducials used in proton therapy for prostate cancer. Phys Med Biol. 2010; 55 (23): 7135–47. - PubMed
-
- Nichiporov D, Moskvin V, Fanelli L, Das IJ. Range shift and dose perturbation with high‐density materials in proton beam therapy. Nucl Instrum Meth Phys Res B. 2011; 269 (22): 2685–92.
MeSH terms
Substances
LinkOut - more resources
Full Text Sources
Other Literature Sources
Medical
