. 2012 Mar 8;7(4):654-69.
doi: 10.1038/nprot.2012.009.

Second harmonic generation microscopy for quantitative analysis of collagen fibrillar structure

Affiliations

Second harmonic generation microscopy for quantitative analysis of collagen fibrillar structure

Xiyi Chen et al. Nat Protoc. .

Abstract

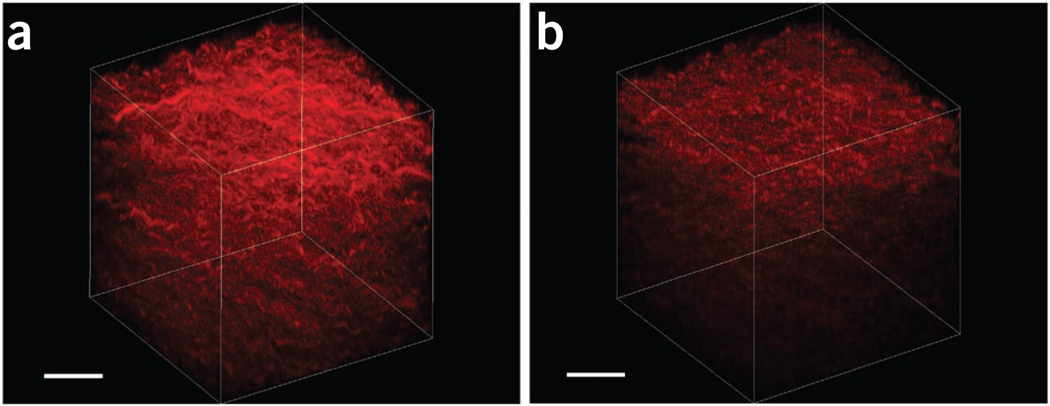
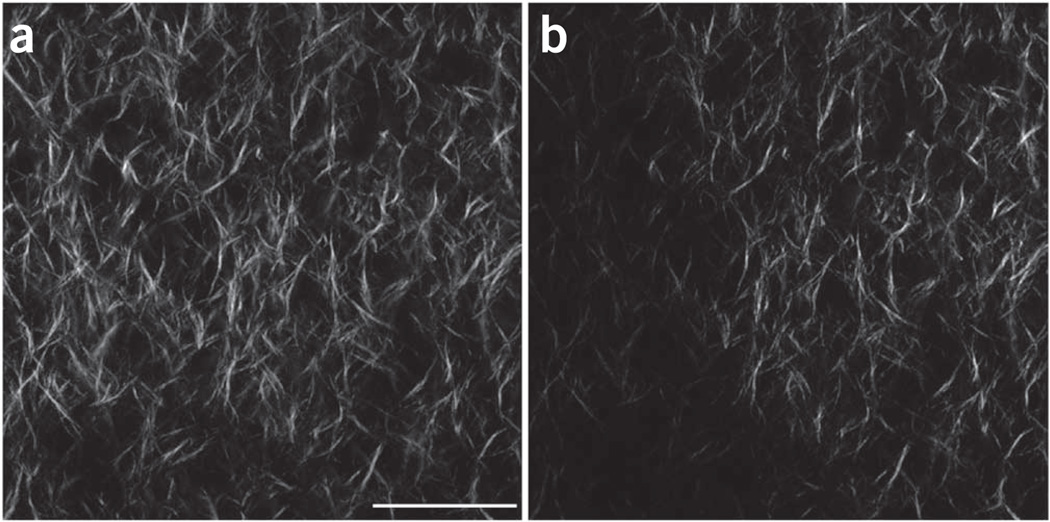
Second-harmonic generation (SHG) microscopy has emerged as a powerful modality for imaging fibrillar collagen in a diverse range of tissues. Because of its underlying physical origin, it is highly sensitive to the collagen fibril/fiber structure, and, importantly, to changes that occur in diseases such as cancer, fibrosis and connective tissue disorders. We discuss how SHG can be used to obtain more structural information on the assembly of collagen in tissues than is possible by other microscopy techniques. We first provide an overview of the state of the art and the physical background of SHG microscopy, and then describe the optical modifications that need to be made to a laser-scanning microscope to enable the measurements. Crucial aspects for biomedical applications are the capabilities and limitations of the different experimental configurations. We estimate that the setup and calibration of the SHG instrument from its component parts will require 2-4 weeks, depending on the level of the user's experience.


Figures

Figure 1
Figure 1
Montage of SHG imaging of collagen tissues. (a–d) The single optical sections show representative images of self-assembled collagen gel (a); mouse dermis (b); mouse bone (c); and human ovary (d). Scale bar, 30 µm.
Figure 2
Figure 2
Schematic of the optical layout of the SHG microscope, showing the optical components before the scan head and the detection pathways. L, lens; λ/2 and λ/4 are half- and quarter-wave plates, respectively.
Figure 3
Figure 3
Comparison of SHG images of self-assembled collagen gels using linear and circular excitation polarization. (a–d) Single optical sections acquired using circular (a) and linear polarization (b), and the resulting respective thresholded images (c and d) show a different distribution of fiber alignment and intensity. We note that these images were acquired with the same excitation power, and the intensities are directly comparable. Scale bar, 20 µm.
Figure 4
Figure 4
Annotated photograph of the upright microscope, detectors and light-tight box.
Figure 5
Figure 5
Annotated photograph of the optical setup for the forward polarization-resolved detection.
Figure 6
Figure 6
Annotated photograph of the optical layout of the laser pathway before the scan head, showing the polarization control optics and the optical rail with apertures used for alignment.
Figure 7
Figure 7
Flowchart of the day-to-day operational procedures for typical SHG imaging of tissues with approximate times and corresponding step numbers. Initial setup procedures are given in Steps 1–8.
Figure 8
Figure 8
Two-photon excited fluorescence images of giant vesicles labeled with the membrane staining dye Di-8-ANEPPS with the rotation of the λ/2 plate. The correct position is at 20 degrees, at which a ring stain is achieved.
Figure 9
Figure 9
SHG intensity dependence on the laser polarization. (a) Representative images are shown for 0°, 45°, 90° and 135°. Scale bar, 50 µm. (b) The resulting plot and fit from optical sections from 37 angles.
Figure 10
Figure 10
Representative SHG polarization anisotropy images for mouse tendon are shown with the GLP oriented parallel and perpendicular to the laser polarization. The depth into tissue was 17 µm. Scale bar, 15 µm.
Figure 11
Figure 11
Using ImageJ to measure collagen fiber lengths. Left, raw SHG image; center, thresholded image used to identify fibers. One fiber (in the red circle) is selected and a freehand line (yellow) is drawn on top to measure its length using the AnalyzeMeasure function. Right, measurement result showing the fiber length in the relative unit of the image (1 unit = 23.9 µm for a field size of 170 × 170 µm).
Figure 12
Figure 12
Forward-backward analysis of SHG image from a fibrillar collagen gel using MATLAB. (a) Screenshot of the MATLAB script used to calculate F/B ratio pixel by pixel and the overall F/B ratio for the entire field of view. Note the highlighted lines for the calibration factor, 1.025, and the small offset, eps (the floating-point relative accuracy for MATLAB that equals 2 ), to avoid division by zero. (b) MATLAB output showing the forward and backward SHG images, the calculated F/B ratio image and the overall F/B ratio.
Figure 13
Figure 13
3D renderings of SHG images of a fibrillar collagen gel. (a,b) The forward and backward results are shown in a and b, respectively. These images are used for calculating forward/backward ratios and attenuation data. Scale bars, 40 µm.
Figure 14
Figure 14
Forward SHG anisotropy images from a fibrillar collagen gel. (a,b) The image in panel a is properly aligned through the microscope and the analyzing Glan-laser polarizer, whereas part of the field is missing in b because the SHG signal does not pass the clear aperture of the polarizer. Scale bar, 40 µm.

References

    1. Campagnola PJ, Dong CY. Second harmonic generation microscopy: principles and applications to disease diagnosis. Laser Photonics Rev. 2011;5:13–26.
    1. Campagnola PJ, Loew LM. Second-harmonic imaging microscopy for visualizing biomolecular arrays in cells, tissues and organisms. Nat. Biotechnol. 2003;21:1356–1360. - PubMed
    1. Campagnola P. Second harmonic generation imaging microscopy: applications to diseases diagnostics. Anal. Chem. 2011;83:3224–3231. - PMC - PubMed
    1. Zipfel WR, et al. Live tissue intrinsic emission microscopy using multiphoton-excited native fluorescence and second harmonic generation. Proc. Natl. Acad. Sci. USA. 2003;100:7075–7080. - PMC - PubMed
    1. Campagnola PJ, et al. 3-Dimesional high-resolution second harmonic generation imaging of endogenous structural proteins in biological tissues. Biophys. J. 2002;82:493–508. - PMC - PubMed

Publication types