

doi: 10.1126/science.1218298.
Fluorescence imaging of cellular metabolites with RNA
Affiliations
- PMID: 22403384
- PMCID: PMC3303607
- DOI: 10.1126/science.1218298
Item in Clipboard
Fluorescence imaging of cellular metabolites with RNA
Science.
.
Abstract
Genetically encoded sensors are powerful tools for imaging intracellular metabolites and signaling molecules. However, developing sensors is challenging because they require proteins that undergo conformational changes upon binding the desired target molecule. We describe an approach for generating fluorescent sensors based on Spinach, an RNA sequence that binds and activates the fluorescence of a small-molecule fluorophore. We show that these sensors can detect a variety of different small molecules in vitro and in living cells. These RNAs constitute a versatile approach for fluorescence imaging of small molecules and have the potential to detect essentially any cellular biomolecule.
Figures
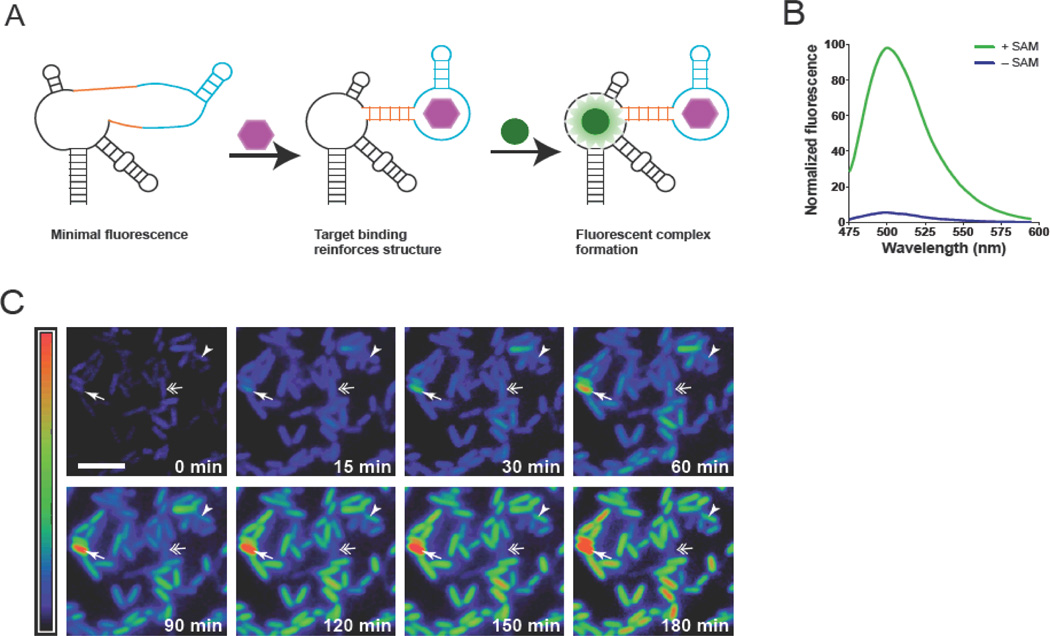
(A) The sensor comprises Spinach (black), a transducer (orange), and target-binding aptamer (blue). Target binding to the aptamer promotes stabilization of the transducer stem, enabling Spinach to fold and activate DFHBI fluorescence. (B) Emission spectra of the SAM sensor in the presence or absence of SAM. (C) Distinct patterns of SAM accumulation after adding methionine to E. coli expressing the SAM sensor RNA. Some cells exhibited higher than average (arrow) or slow increases (arrowhead) in SAM (arrowhead). A cell that first increases and then decreases its SAM levels is indicated by a double arrow. Images are pseudocolored to show the fold increase in fluorescence at each time point relative to 0 min (0-11.2-fold). Scale bar, 5 µm.
References
Publication types
MeSH terms
Substances
Grants and funding
LinkOut - more resources
Full Text Sources
Other Literature Sources
Molecular Biology Databases
