. 2012 May 4;287(19):15811-25.
doi: 10.1074/jbc.M111.334052. Epub 2012 Mar 8.

Three acyltransferases and nitrogen-responsive regulator are implicated in nitrogen starvation-induced triacylglycerol accumulation in Chlamydomonas

Affiliations

Three acyltransferases and nitrogen-responsive regulator are implicated in nitrogen starvation-induced triacylglycerol accumulation in Chlamydomonas

Nanette R Boyle et al. J Biol Chem. .

Abstract

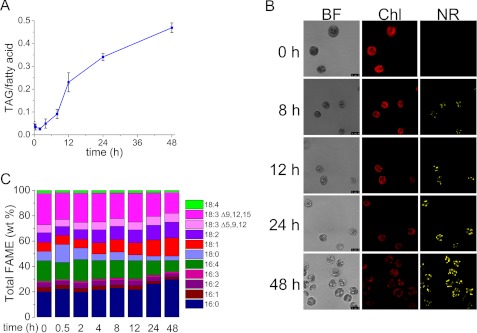
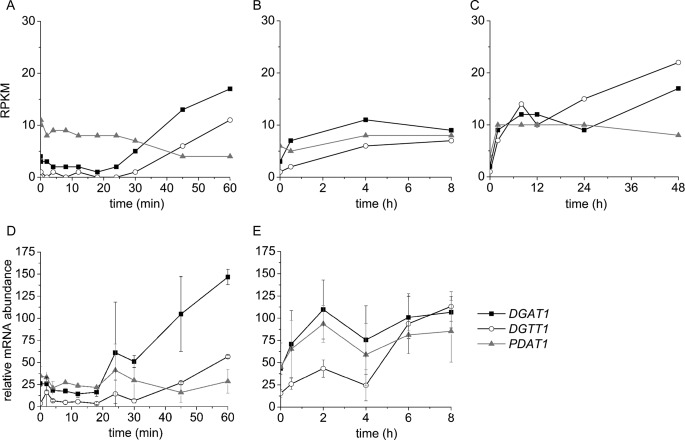
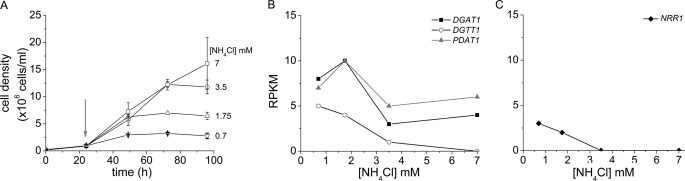
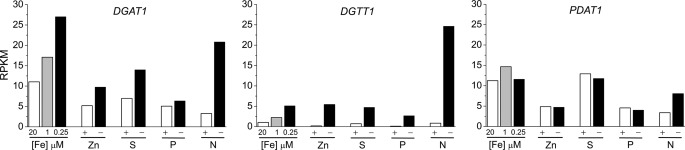
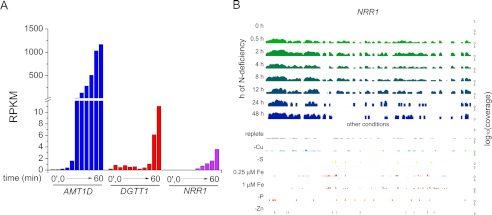
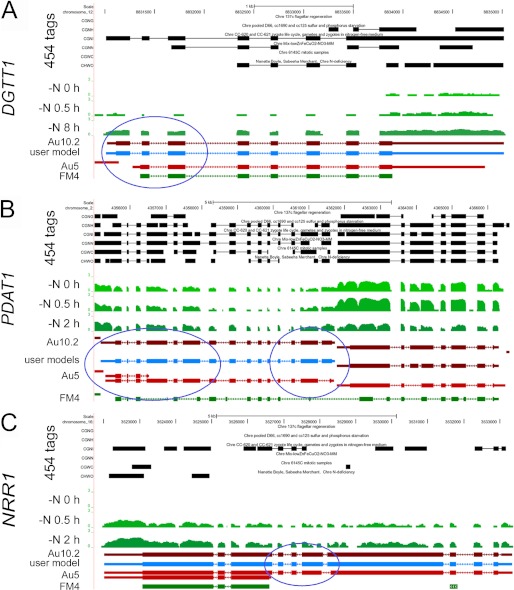
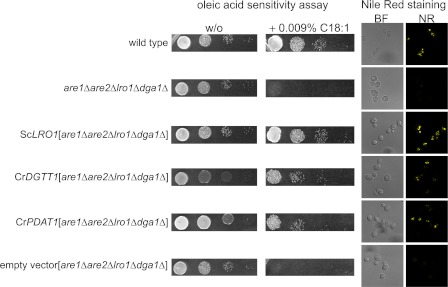
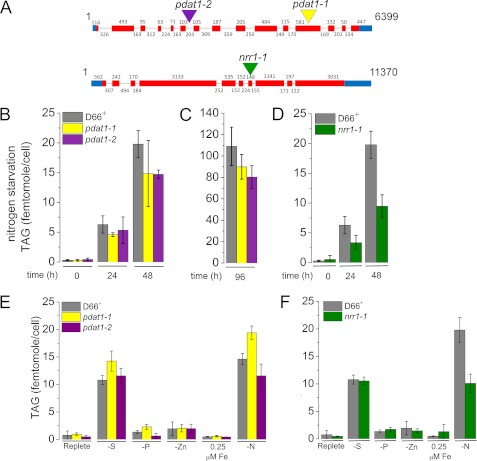
Algae have recently gained attention as a potential source for biodiesel; however, much is still unknown about the biological triggers that cause the production of triacylglycerols. We used RNA-Seq as a tool for discovering genes responsible for triacylglycerol (TAG) production in Chlamydomonas and for the regulatory components that activate the pathway. Three genes encoding acyltransferases, DGAT1, DGTT1, and PDAT1, are induced by nitrogen starvation and are likely to have a role in TAG accumulation based on their patterns of expression. DGAT1 and DGTT1 also show increased mRNA abundance in other TAG-accumulating conditions (minus sulfur, minus phosphorus, minus zinc, and minus iron). Insertional mutants, pdat1-1 and pdat1-2, accumulate 25% less TAG compared with the parent strain, CC-4425, which demonstrates the relevance of the trans-acylation pathway in Chlamydomonas. The biochemical functions of DGTT1 and PDAT1 were validated by rescue of oleic acid sensitivity and restoration of TAG accumulation in a yeast strain lacking all acyltransferase activity. Time course analyses suggest than a SQUAMOSA promoter-binding protein domain transcription factor, whose mRNA increases precede that of lipid biosynthesis genes like DGAT1, is a candidate regulator of the nitrogen deficiency responses. An insertional mutant, nrr1-1, accumulates only 50% of the TAG compared with the parental strain in nitrogen-starvation conditions and is unaffected by other nutrient stresses, suggesting the specificity of this regulator for nitrogen-deprivation conditions.


Figures

FIGURE 1.
FIGURE 1.
Time course of increased TAG accumulation in nitrogen-starved C. reinhardtii wild type (CC-3269) cells. A, fraction of fatty acids in TAG in nitrogen-starved cells during a 48-h time course of nitrogen starvation on a mol/mol basis. Error bars represent standard deviation from three biological replicates. Two-tailed Student's t test on experimental triplicates for each time point indicate that 8-, 12-, 24-, and 48-h samples are statistically different from the 0-h sample at 98% confidence. B, confocal microscopy of nitrogen-starved cells to visualize TAG by Nile Red staining. BF, bright field; Chl, chlorophyll autofluorescence; NR, Nile Red fluorescence. C, fatty acid composition of lipids at each time point was measured by gas chromatography; the average of three experimental replicates is shown. Microscopy of cells in replete medium is given in supplemental Fig. S3.
FIGURE 2.
FIGURE 2.
Increased expression of DGAT1, DGTT1, and PDAT1 encoding three nitrogen deficiency-responsive acyltransferases. mRNA abundance was reported in RPKM in a 1-h time course (A), 8-h time course (B), and 48-h time course (C) after the onset of nitrogen starvation. Relative mRNA abundance in a 1-h time course (D) and 8-h time course (E) was measured by real time PCR. Error bars on D and E are standard deviations from two biological samples analyzed in technical triplicate.
FIGURE 3.
FIGURE 3.
Impact of nitrogen nutrition on cell growth (A) and mRNA abundance of DGAT1, DGTT1, and PDAT1 (B), and NRR1 (C). Chlamydomonas cells were grown with various amounts of ammonium chloride (see under “Experimental Procedures”), and RNA was sampled at a cell density of 1 × 10⁶ cells ml−1 (indicated with an arrow) when cells were still growing at the same rate.
FIGURE 4.
FIGURE 4.
Response of DGAT1, DGTT1, and PDAT1 mRNA abundance to other TAG-accumulating conditions. Cells were grown in TAP medium under replete (20 μm iron, zinc, sulfur, phosphorus, and nitrogen), deficient (1 or 0.25 μm iron), or nutrient starvation (minus zinc, minus sulfur, minus phosphorus, and minus nitrogen) conditions as described under “Experimental Procedures.” mRNA abundance is expressed in RPKM.
FIGURE 5.
FIGURE 5.
Pattern of expression of the nitrogen-responsive regulator, NRR1. A, mRNA abundance of an ammonium transporter AMT1D, an acyltransferase DGTT1, and NRR1. B, browser view of the Chlamydomonas NRR1 locus; nitrogen starvation mRNA abundance is shown at the top (0–48 h) and other conditions (replete, minus copper, and minus sulfur, 0.25 μm iron, 1 μm iron, minus phosphorus, and minus zinc sampled as described under “Experimental Procedures”) are below. Note that the y axis, representing absolute expression (RPKM) is presented on a log10 scale (0–3 in each case, covering 3 orders of magnitude); the differences in RNA abundance between minus nitrogen and the other deficiency conditions is substantial. A larger version of this figure is shown in supplemental Fig. S11, and the complete data set is available via the UCSC browser on line.
FIGURE 6.
FIGURE 6.
Browser view of Chlamydomonas DGTT1 (A), PDAT1 (B), and NRR1 (C) loci. The UCSC browser was used to view RNA-Seq coverage. The genome coordinates are shown at the top. The next six tracks labeled 454 ESTs represent sequences, collapsed into a single track, from the UCLA/JGI EST project (accession SRX038871). The tracks shown in green represent RNA-Seq coverage, on a log scale, for the locus at three time points (0, 0.5, and 2 h) after Chlamydomonas cells were transferred to nitrogen-depleted medium. The JGI best gene model for the V4 assembly, FM4, and two different gene models predicted by the Augustus algorithm (Au5 and Au10.2), are shown in green and red, respectively. Thick blocks represent exons, and thin blocks represent UTRs, and arrowed lines represent introns. RNA-Seq, 454, and EST coverage were used to inform the manual construction of a single gene model at each locus, labeled user model and shown in blue. The PDAT1 gene is on the left, and the gene model on the right represents an expressed hypothetical protein whose expression is decreased in nitrogen starvation. The blue circles highlight new exons suggested by the patterns of RNA-Seq coverage and incorporated by manual curation into revised gene models. The complete data set is available via the UCSC browser on line.
FIGURE 7.
FIGURE 7.
Functional assessment of DGTT1 and PDAT1 in yeast. Left panel, oleic acid (C18:1) sensitivity assay of wild type, acyltransferase-deficient yeast, and complemented strains. Yeast strains were grown on agar supplemented with oleic acid (0.009% (w/v)) or not (w/o). Wild type, are1Δare2Δlro1Δdga1Δ (quadruple mutant lacking all diacylglycerol acyltransferase activity), and mutant strains complemented with ScLRO1 (encoding PDAT), codon-optimized CrDGTT1, codon-optimized PDAT1, or an empty vector were grown to an A600 = 1 diluted 10-fold and plated in serial 10-fold dilutions. Right, Nile Red staining of lipid bodies in each yeast strain described above.
FIGURE 8.
FIGURE 8.
Phenotype of C. reinhardtii strains carrying inserts in the PDAT1 and NRR1 genes. A, site of insert of AphVIII into genomic DNA in the PDAT1 and NRR1 mutants is indicated with a colored triangle (see supplemental Table 6 for exact position of inset). B, TAG content of pdat1-1 (yellow), pdat1-2 (purple), and the parent strain CC-4425 (D66+) (gray) measured at 0, 24, and 48 h after nitrogen starvation by quantitative gas chromatography as described under “Experimental Procedures.” C, TAG content of pdat1-1 (yellow) and pdat1-2 (purple) after 96 h of nitrogen starvation. D, TAG content of nrr1 (green) and the parent strain CC-4425 (D66+) (gray) measured at 0, 24, and 48 h after nitrogen starvation. E, phenotype of pdat1-1 and pdat1-2 mutants in other TAG-accumulating conditions (−PO4 and −SO4, 0.25 μm iron, and −zinc). F, phenotype of nrr1-1 mutants in other TAG accumulating conditions (−PO4 and −SO4, 0.25 μm iron, and minus zinc). Error bars represent standard deviation from three biological replicates except for C, which is from six biological replicates. Two-tailed Student's t test on the data indicate that pdat1-1 and pdat1-2 are statistically different from the parent strain after 96 h of nitrogen starvation at 93 and 99% confidence levels, respectively; nrr1-1 is also significantly different at 48 h of nitrogen starvation at 99% confidence.

References

    1. Merchant S. S., Kropat J., Liu B., Shaw J., Warakanont J. (2012) TAG, You're it! Chlamydomonas as a reference organism for understanding algal triacylglycerol accumulation. Curr. Opin. Biotechnol. 23, 1–12 - PubMed
    1. Chisti Y. (2008) Biodiesel from microalgae beats bioethanol. Trends Biotechnol. 26, 126–131 - PubMed
    1. Chisti Y. (2007) Biodiesel from microalgae. Biotechnol. Adv. 25, 294–306 - PubMed
    1. Scott S. A., Davey M. P., Dennis J. S., Horst I., Howe C. J., Lea-Smith D. J., Smith A. G. (2010) Biodiesel from algae. Challenges and prospects. Curr. Opin. Biotechnol. 21, 277–286 - PubMed
    1. Schenk P., Thomas-Hall S., Stephens E., Marx U., Mussgnug J., Posten C., Kruse O., Hankamer B. (2008) Second generation biofuels. High efficiency microalgae for biodiesel production. BioEnergy Res. 1, 20–43

Publication types

MeSH terms

Associated data