. 2012 May;50(5):1711-7.
doi: 10.1128/JCM.00117-12. Epub 2012 Mar 7.

Multicytokine detection improves latent tuberculosis diagnosis in health care workers

Affiliations

Multicytokine detection improves latent tuberculosis diagnosis in health care workers

Pierre-Alain Rubbo et al. J Clin Microbiol. 2012 May.

Abstract

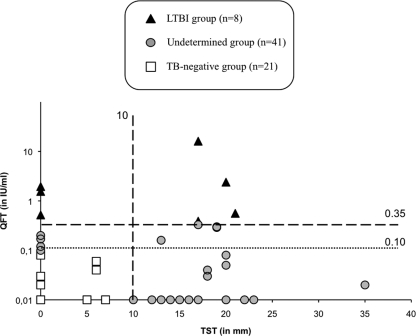
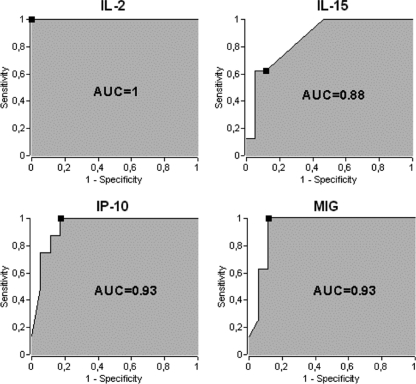
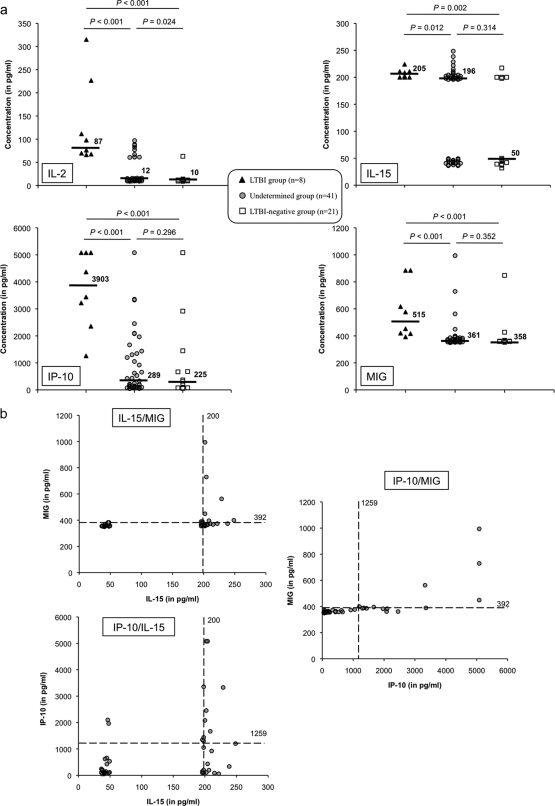
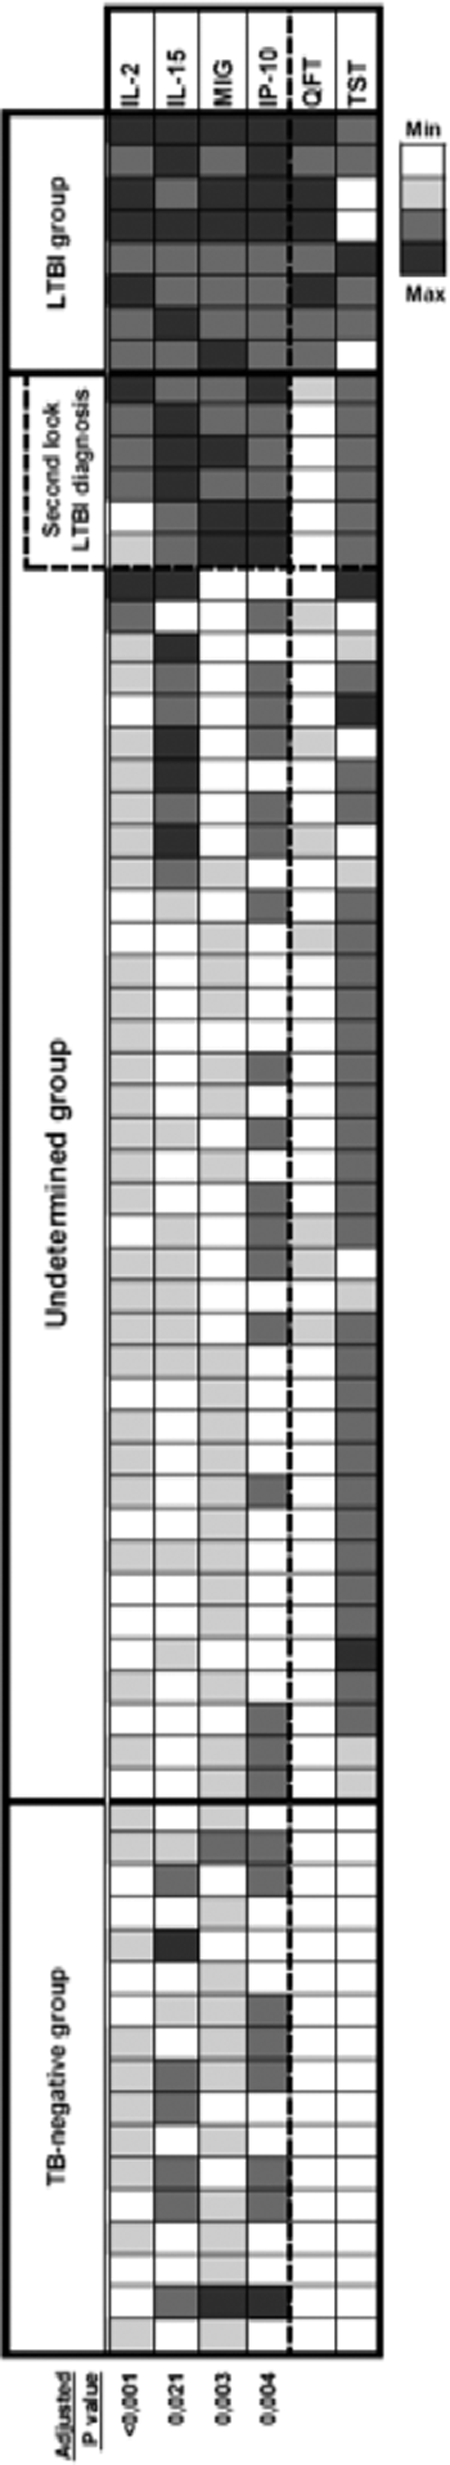
In a low-incidence setting, health care workers (HCW) are at a higher risk of tuberculosis than the general population. The suboptimal sensitivity of the QuantiFERON-TB Gold In-Tube (QFT) test remains a critical issue when identifying occupational latent tuberculosis infection (LTBI) in HCW. The aim of this study was to identify additional biomarkers in order to overcome the limits of gamma interferon (IFN-γ) release assays (IGRAs) and improve the performance of LTBI diagnosis within this population. Seventy Bacille Calmette-Guérin-vaccinated HCW regularly exposed to Mycobacterium tuberculosis were grouped according to QFT results into an LTBI-positive group (positive QFT, n = 8), an LTBI-negative group (normal QFT and negative tuberculin skin test [TST], n = 21), and an undetermined group (subpositive QFT and/or positive TST, n = 41). The secretion of 22 cytokines in response to QFT-specific stimulation was quantified using a multiparameter-based immunoassay. As a result, thresholds discriminating LTBI-positive from LTBI-negative HCW were established by comparing areas under the receiver operating characteristic curves for interleukin-2 (IL-2), IL-15, IFN-γ-induced protein 10 (IP-10), and the monokine induced by IFN-γ (MIG), which are biomarkers differentially secreted by the two groups. The combination of IL-15 and MIG provided a sensitivity of 100% and a specificity of 94.1% in distinguishing LTBI-positive from LTBI-negative HCW. When using IL-15 and MIG among the undetermined group, 6/45 HCW could be classified in the LTBI-positive group. The use of additional biomarkers after IGRA screening could improve the diagnosis of LTBI. The performance of these biomarkers and their use in combination with TST and/or QFT, as well as the cost-effectiveness of such a diagnostic strategy, should be evaluated in further larger clinical trials.


Figures

Fig 1
Fig 1
QFT assay and TST results of 70 HCW. QFT assay values were obtained after ex vivo stimulation with ESAT-6, CFP-10, and TB7.7 antigens, while TST values are the results of tuberculin stimulation. Participants were stratified into three distinct groups according to their QFT assay and TST results. The black lines represent the cutoff value of the commercially available QFT assay of 0.35 IU/ml and the TST of 10 mm, while the dotted line represents the threshold value of a subpositive QFT assay response (i.e., 0.1 IU/ml).
Fig 2
Fig 2
Determination of additional biomarkers for the diagnosis of HCW with LTBI. IL-2, IL-15, IP-10, and MIG secretion levels were quantified in QFT supernatants, and ROC curves display sensitivity versus specificity for each biomarker in differentiating the LTBI-positive group from the LTBI-negative group. The black squares correspond to the maximum YI. The AUC is indicated in each graph.
Fig 3
Fig 3
Identification of additional biomarkers for improved LTBI detection in HCW in the undetermined group. Individual IL-2, IL-15, IP-10, and MIG concentrations are shown for the LTBI-positive (black triangles), undetermined (gray circles), and LTBI-negative (white squares) groups of HCW in panel a, while two-by-two combinations of these cytokines are shown for the undetermined group of HCW only in panel b. The dotted line represents the cutoff value of each cytokine as previously determined with ROC curves. The median concentration of each biomarker for each group is shown in each panel. A P value of <0.05 indicates a significant difference between groups using the adjusted Mann-Whitney U test.
Fig 4
Fig 4
Positivity for additional biomarkers for the diagnosis of LTBI in 69 HCW after RD1 stimulation. Cytokine secretion is shown as a heat map, with each row representing the cytokine concentrations in individual HCW. Only cytokines for which a significant difference was observed between the LTBI-positive and LTBI-negative groups after adjustment for multiple comparisons are represented. Adjusted P values are shown below the heat map. HCW are ranked according to cytokine concentrations and TST and QFT test results. For each parameter, an appropriate color was assigned ranging from white, representing the lowest values (TST, ≤5 mm; QFT, <0.1 IU/ml; cytokine concentrations less than the median of the LTBI-negative group), to black, symbolizing the highest values (TST, >20 mm; QFT, greater than or equal to the median of those of the LTBI-positive group, i.e., 1.055 IU/ml; cytokine concentrations greater than or equal to the median of those of the LTBI-positive group), passing by light gray (TST [5 to 10] mm, QFT [0.1 to 0.35] IU/ml, and cytokine concentrations [the median in the LTBI-negative group to the cytokine thresholds]) and dark gray (TST [10 to 20] mm, QFT [0.35 to the median in the LTBI-positive group, i.e., 1.055 [IU/ml, and cytokine concentrations [the cytokine thresholds to the median in the LTBI-positive group]). The second-look LTBI diagnosis was done using IL-15 and MIG measurements after the QFT assay and previously defined thresholds.

Similar articles

Cited by

References

    1. Abdalhamid B, et al. 2010. Utilization of the QuantiFERON-TB Gold test in a two-step process with the tuberculin skin test to evaluate health care workers for latent tuberculosis. J. Clin. Microbiol. 48:2955–2956 - PMC - PubMed
    1. Abramo C, et al. 2006. Monokine induced by interferon gamma and IFN-gamma response to a fusion protein of Mycobacterium tuberculosis ESAT-6 and CFP-10 in Brazilian tuberculosis patients. Microbes Infect. 8:45–51 - PubMed
    1. Andersen P, Munk ME, Pollock JM, Doherty TM. 2000. Specific immune-based diagnosis of tuberculosis. Lancet 356:1099–1104 - PubMed
    1. Anonymous 2006. Test de detection de la production d'interféron-gamma pour le diagnostic des infections tuberculeuses. Haute Autorité de Santé, Saint-Denis La Plaine, France: http://www.has-sante.fr/portail/upload/docs/application/pdf/synthese_det...
    1. Biselli R, et al. 2010. Detection of interleukin-2 in addition to interferon-gamma discriminates active tuberculosis patients, latently infected individuals, and controls. Clin. Microbiol. Infect. 16:1282–1284 - PubMed

Publication types