

Old and new ideas for data screening and assumption testing for exploratory and confirmatory factor analysis
- PMID: 22403561
- PMCID: PMC3290828
- DOI: 10.3389/fpsyg.2012.00055
Old and new ideas for data screening and assumption testing for exploratory and confirmatory factor analysis
Abstract
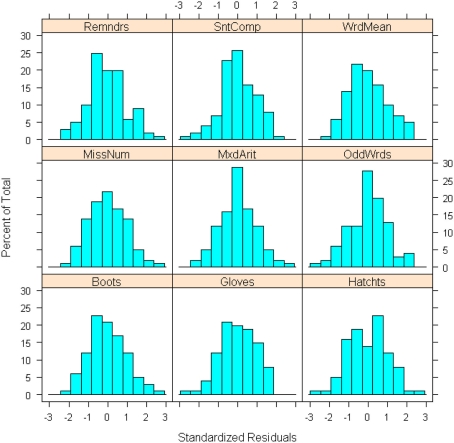
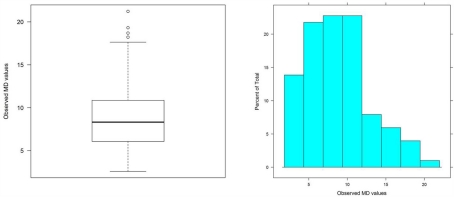
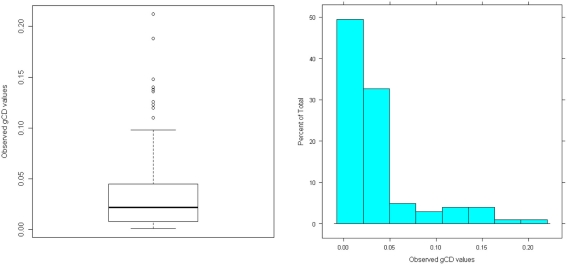
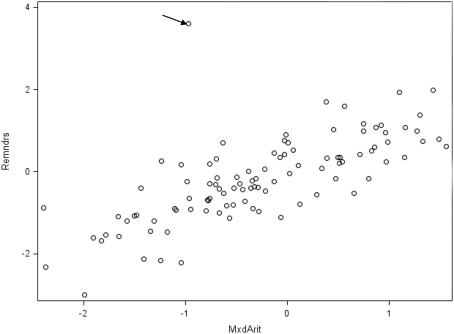
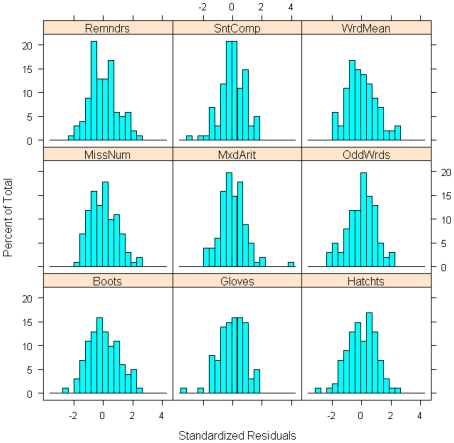
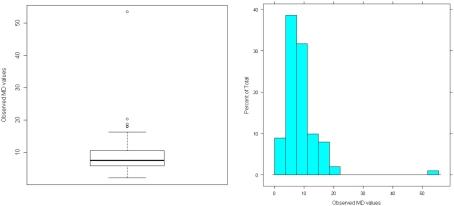
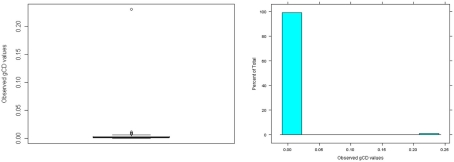
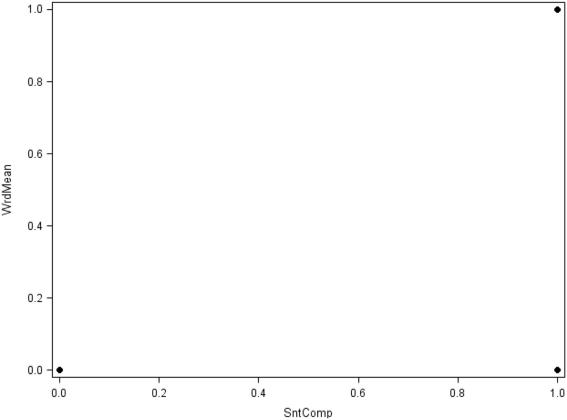
We provide a basic review of the data screening and assumption testing issues relevant to exploratory and confirmatory factor analysis along with practical advice for conducting analyses that are sensitive to these concerns. Historically, factor analysis was developed for explaining the relationships among many continuous test scores, which led to the expression of the common factor model as a multivariate linear regression model with observed, continuous variables serving as dependent variables, and unobserved factors as the independent, explanatory variables. Thus, we begin our paper with a review of the assumptions for the common factor model and data screening issues as they pertain to the factor analysis of continuous observed variables. In particular, we describe how principles from regression diagnostics also apply to factor analysis. Next, because modern applications of factor analysis frequently involve the analysis of the individual items from a single test or questionnaire, an important focus of this paper is the factor analysis of items. Although the traditional linear factor model is well-suited to the analysis of continuously distributed variables, commonly used item types, including Likert-type items, almost always produce dichotomous or ordered categorical variables. We describe how relationships among such items are often not well described by product-moment correlations, which has clear ramifications for the traditional linear factor analysis. An alternative, non-linear factor analysis using polychoric correlations has become more readily available to applied researchers and thus more popular. Consequently, we also review the assumptions and data-screening issues involved in this method. Throughout the paper, we demonstrate these procedures using an historic data set of nine cognitive ability variables.
Keywords: assumption testing; confirmatory factor analysis; data screening; exploratory factor analysis; item factor analysis; regression diagnostics; structural equation modeling.
Figures

References
-
- Asparouhov T., Muthén B. (2009). Exploratory structural equation modeling. Struct. Equ. Modeling 16, 397–438 10.1080/10705510903008204 - DOI
-
- Babakus E., Ferguson C. E., Joreskög K. G. (1987). The sensitivity of confirmatory maximum likelihood factor analysis to violations of measurement scale and distributional assumptions. J. Mark. Res. 37, 72–141
-
- Bartholomew D. J. (2007). “Three faces of factor analysis,” in Factor Analysis at 100: Historical Developments and Future Directions, eds Cudeck R., MacCallum R. C. (Mahwah, NJ: Lawrence Erlbaum Associates; ), 9–21
-
- Belsley D. A., Kuh E., Welsch R. E. (1980). Regression Diagnostics: Identifying Influential Data and Sources of Collinearity. New York: Wiley
-
- Bentler P. M. (2004). EQS 6 Structural Equations Program Manual. Encino, CA: Multivariate Software, Inc
LinkOut - more resources
Full Text Sources
Other Literature Sources