Comparative Study
. 2012 May 15;302(10):C1513-22.
doi: 10.1152/ajpcell.00371.2011. Epub 2012 Mar 7.

Interleukin-1β-induced barrier dysfunction is signaled through PKC-θ in human brain microvascular endothelium

Affiliations
Comparative Study

Interleukin-1β-induced barrier dysfunction is signaled through PKC-θ in human brain microvascular endothelium

Robert R Rigor et al. Am J Physiol Cell Physiol. .

Abstract

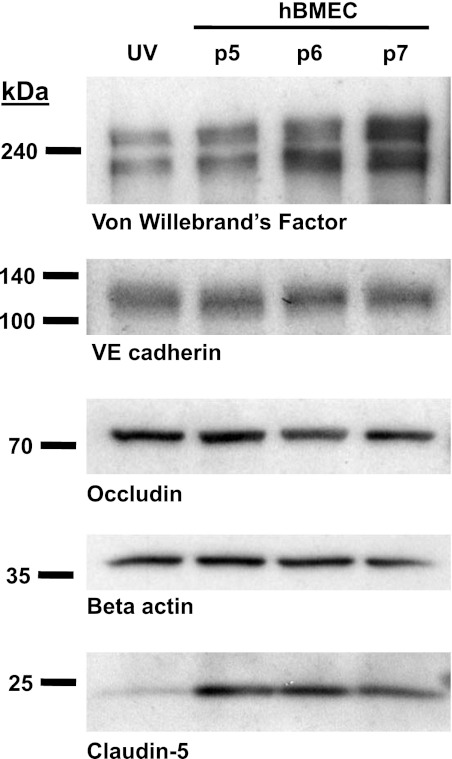
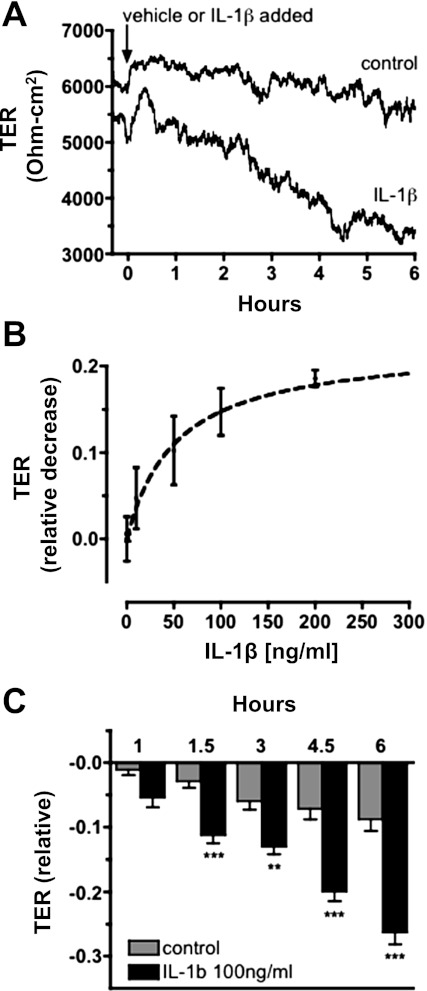
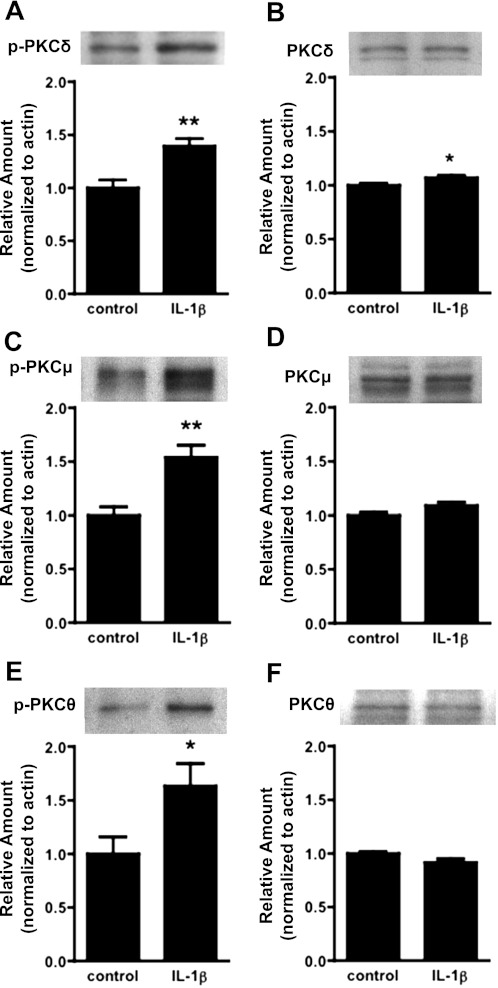
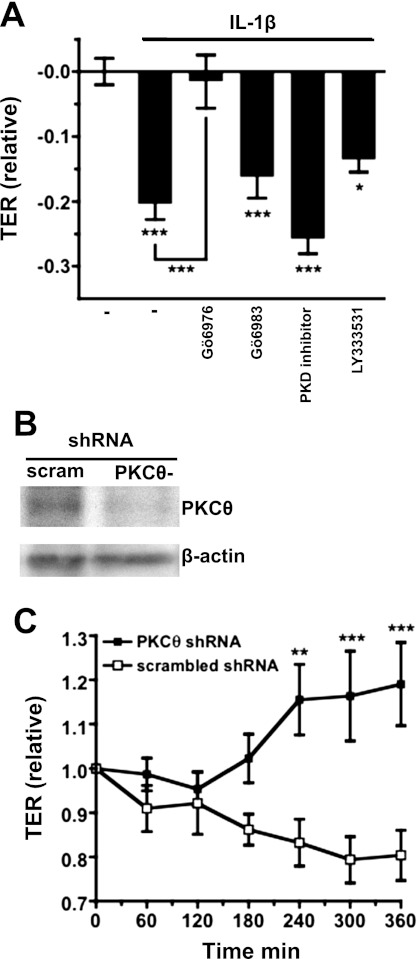
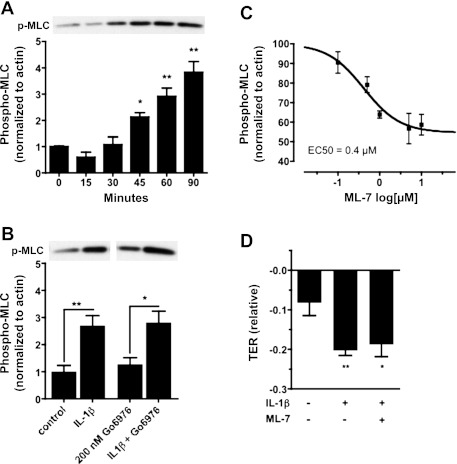
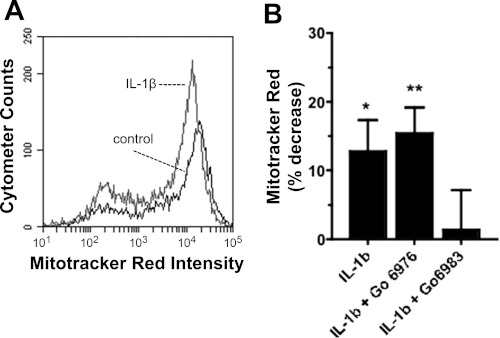
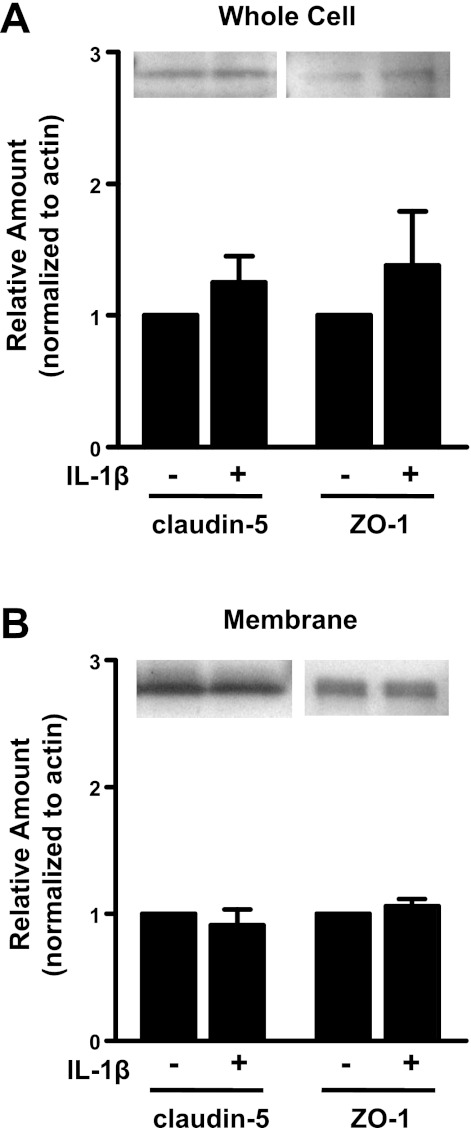
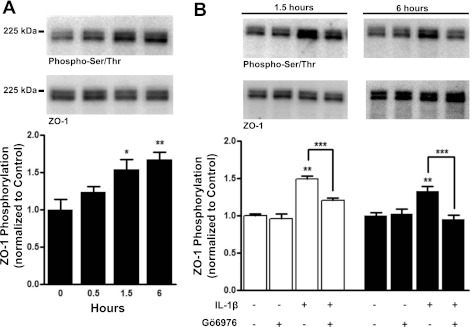
Blood-brain barrier dysfunction is a serious consequence of inflammatory brain diseases, cerebral infections, and trauma. The proinflammatory cytokine interleukin (IL)-1β is central to neuroinflammation and contributes to brain microvascular leakage and edema formation. Although it is well known that IL-1β exposure directly induces hyperpermeability in brain microvascular endothelium, the molecular mechanisms mediating this response are not completely understood. In the present study, we found that exposure of the human brain microvascular endothelium to IL-1β triggered activation of novel PKC isoforms δ, μ, and θ, followed by decreased transendothelial electrical resistance (TER). The IL-1β-induced decrease in TER was prevented by small hairpin RNA silencing of PKC-θ or by treatment with the isoform-selective PKC inhibitor Gö6976 but not by PKC inhibitors that are selective for all PKC isoforms other than PKC-θ. Decreased TER coincided with increased phosphorylation of regulatory myosin light chain and with increased proapoptotic signaling indicated by decreased uptake of mitotracker red in response to IL-1β treatment. However, neither of these observed effects were prevented by Gö6976 treatment, indicating lack of causality with respect to decreased TER. Instead, our data indicated that the mechanism of decreased TER involves PKC-θ-dependent phosphorylation of the tight junction protein zona occludens (ZO)-1. Because IL-1β is a central inflammatory mediator, our interpretation is that inhibition of PKC-θ or inhibition of ZO-1 phosphorylation could be viable strategies for preventing blood-brain barrier dysfunction under a variety of neuroinflammatory conditions.


Figures

Fig. 1.
Fig. 1.
Western blot evidence for expression of endothelial specific and tight junction markers in human brain microvascular endothelial cells (hBMECs). Shown (left to right) are Western blot data for cell lysates of human umbilical vein endothelial cells (UV; lane 1), and hBMECs at passage 5, 6 and 7 (lanes 2, 3, and 4, respectively). Western blot bands correspond to von Willebrand's factor, vascular endothelial (VE)-cadherin, occludin, β-actin, and claudin-5, with positions of molecular mass markers shown at left (represents n ≥ 4 similar results).
Fig. 2.
Fig. 2.
Transendothelial resistance (TER) is decreased in response to IL-1β in hBMEC monolayers. A: representative electrical cell impedance sensor (ECIS) trace showing a typical TER response. TER is minimally affected in response to treatment with vehicle alone (water 0.1% vol/vol; control); TER is steadily decreased in response to IL-1β treatment. Time of treatments added is indicated (arrow). Typical TER values for hBMEC monolayers were in the range of 5,000–8,000 Ω-cm2. B: IL-1β dose-response curve showing the decrease in TER relative to the time-matched control at 6 h after treatment with IL-1β; estimated half-maximal effective concentration (EC50) of IL-1β is 53 ng/ml. C: relative change in TER measured at specified intervals after addition of IL-1β or vehicle alone. TER data are compiled from multiple (n ≥ 30) ECIS determinations, and statistically significant differences (**P < 0.01, ***P < 0.001) are seen at 1.5–6 h after addition of IL-1β.
Fig. 3.
Fig. 3.
Activation of novel PKC isoforms in hBMECs in response to IL-1β exposure. Cells were treated for 1.5 h with IL-1β (100 ng/ml), and Western blots were performed with hBMEC lysates to probe for activation (phosphorylation) and expression of novel PKC isoforms δ, μ, and θ. There were significant increases in amounts of phosphorylated (p-)PKC δ, μ, and θ (A, C, and E). There were no substantial changes in expression of total PKC δ, μ, or θ (B, D, and F), although a modest increase in expression of PKC-δ was noted. Blots represent n ≥ 4 independent experiments, with quantitative data at bottom (band intensity normalized to β-actin). (*P < 0.05, **P < 0.01).
Fig. 4.
Fig. 4.
Effects of PKC isoform selective inhibitors on TER in hBMEC monolayers. A: monolayers were treated for 30 min with PKC isoform-selective pharmacological inhibitors before addition of IL-1β (100 ng/ml) for 6 h. Treatment with 200 nM Gö6976 prevented decreased TER in response to IL-1β treatment (P < 0.001). In contrast, treatment with 100 nM Gö6983, 2 μM PKD inhibitor, or 100 nM LY333531 failed to prevent decreased TER in response to IL-1β (decreased TER was significant compared with control; P < 0.001, 0.001, and 0.05, respectively). B: Western blots showing expression levels of PKC-θ in lysates of hBMECs stably transfected with PKC-θ or scrambled sequence (control) small hairpin (sh)RNA. PKC-θ protein expression is decreased in cells transfected with PKC-θ shRNA relative to control. C: TER (ECIS) measurements in monolayers of hBMECs stably transfected with shRNA. In response to addition of IL-1β (100 ng/ml), TER declines in hBMECs transfected with scrambled shRNA. In contrast, TER does not decline in response to IL-1β in hBMECs transfected with PKC-θ shRNA. TER values are significantly higher in hBMECs transfected with PKC-θ shRNA than in the scrambled shRNA controls at 4, 5, or 6 h after addition of IL-1β (*P< 0.05, **P < 0.01, ***P < 0.001).
Fig. 5.
Fig. 5.
Phosphorylation of regulatory myosin light chain (MLC-2) in response to IL-1β treatment in hBMECs. A: Western blot data showing an increase in phosphorylated MLC-2 (p-MLC) over time in response to IL-1β treatment. A representative blot showing increasing p-MLC band intensity after IL-1β exposure is shown at top. Corresponding quantitative data (band intensity normalized to β-actin) are shown at bottom. Statistically significant increases are seen at 45, 60, and 90 min after IL-1β treatment (P < 0.05, 0.01, and 0.01, respectively). B: Western blot data showing increased p-MLC band reactivity at 90 min after IL-1β treatment. Increased p-MLC is not prevented by treatment with 200 nM Gö6976 for 30 min before IL-1β exposure. Corresponding quantitative data (band intensity normalized to β-actin) are shown below (P < 0.01 or 0.05 vs. control, respectively). C: Western blots show dose-dependent inhibition of MLC-2 phosphorylation in response to ML-7 treatment. Data are quantified (normalized to actin) and fit to a sigmoidal dose-response curve (IC50 = 0.4 μM). D: treatment with 5 μM ML-7 for 1 h fails to prevent the IL-1β (100 ng/ml)-induced decrease in TER at 6 h. Mean TER values are significantly decreased following IL-1β treatment in the presence or absence of ML-7 (P < 0.05 or 0.01, respectively) compared with the control condition. Data shown are means ± SE; represents n ≥ 4 independent experiments (*P< 0.05, **P < 0.01).
Fig. 6.
Fig. 6.
Flow cytometric analysis of mitotracker red uptake by hBMECs following IL-1β treatment for 90 min. A: data showing decreased intensity of mitotracker red in hBMECs following treatment with IL-1β (represents similar results from n = 6 independent experiments). B: percent change in mean mitotracker red intensity of hBMECs relative to control, following treatment with IL-1β after 30 min of treatment with vehicle alone, 200 nM Gö6976, or 100 nM Gö6983. Mitotracker red intensity was significantly decreased (positive %change) by treatment with IL-1β alone or in the presence of Gö6976 (P < 0.05 or 0.01, respectively). In contrast, Gö6983 treatment prevented the decreased mitotracker red intensity in response to IL-1β (*P < 0.05, **P < 0.01).
Fig. 7.
Fig. 7.
Expression and phosphorylation of tight junction proteins in hBMECs following 6 h of IL-1β treatment. Western blot data shows no significant (P > 0.05) change in expression of claudin-5 or zona occludens (ZO)-1 in hBMEC whole cell lysates (A) or membrane fractions (B). Representative Western blots are shown (top) together with quantified data normalized to β-actin (bottom) from n ≥ 4 independent experiments.
Fig. 8.
Fig. 8.
Western blots of ZO-1 immunoprecipitated from hBMEC membrane fractions show phosphorylated serine/threonine (p-Ser/Thr) reactive blots and the corresponding ZO-1 reactive blots detected at the same position on the same PVDF membrane stripped and reprobed with ZO-1 antibody (top). Quantitative data showing the ratio of p-Ser/Thr to total ZO-1 compiled from multiple experiments are also shown (bottom). A: hBMECs treated with 100 ng/ml IL-1β for 30 min, 1.5 h or 6 h, show that total serine/threonine phosphorylation of immunoprecipitated ZO-1 is significantly increased at 1.5 h and 6 h (P < 0.05 and 0.01, respectively; n = 4). B: there is a significant decrease in p-Ser/Thr reactivity of ZO-1 following treatment with Gö6976 and IL-1β relative to IL-1β alone following 1.5 h (left; open bars) or 6 h (right; closed bars) of IL-1β treatment (P < 0.001; n = 4 or 10, respectively) (*P < 0.05, **P < 0.01, ***P < 0.001).

References

    1. Abbott NJ, Patabendige AA, Dolman DE, Yusof SR, Begley DJ. Structure and function of the blood-brain barrier. Neurobiol Dis 37: 13– 25, 2010 - PubMed
    1. Aiello LP, Bursell SE, Clermont A, Duh E, Ishii H, Takagi C, Mori F, Ciulla TA, Ways K, Jirousek M, Smith LE, King GL. Vascular endothelial growth factor-induced retinal permeability is mediated by protein kinase C in vivo and suppressed by an orally effective beta-isoform-selective inhibitor. Diabetes 46: 1473– 1480, 1997 - PubMed
    1. Aiello LP, Clermont A, Arora V, Davis MD, Sheetz MJ, Bursell SE. Inhibition of PKC beta by oral administration of ruboxistaurin is well tolerated and ameliorates diabetes-induced retinal hemodynamic abnormalities in patients. Invest Ophthalmol Vis Sci 47: 86– 92, 2006 - PubMed
    1. Allan SM, Rothwell NJ. Inflammation in central nervous system injury. Philos Trans R Soc Lond B Biol Sci 358: 1669– 1677, 2003 - PMC - PubMed
    1. Antonetti DA, Barber AJ, Hollinger LA, Wolpert EB, Gardner TW. Vascular endothelial growth factor induces rapid phosphorylation of tight junction proteins occludin and zonula occluden 1. A potential mechanism for vascular permeability in diabetic retinopathy and tumors. J Biol Chem 274: 23463– 23467, 1999 - PubMed

Publication types

MeSH terms