Review
. 2012:41:543-56.
doi: 10.1146/annurev-biophys-042910-155238. Epub 2012 Feb 23.

Receptor signaling clusters in the immune synapse

Affiliations
Review

Receptor signaling clusters in the immune synapse

Michael L Dustin et al. Annu Rev Biophys. 2012.

Abstract

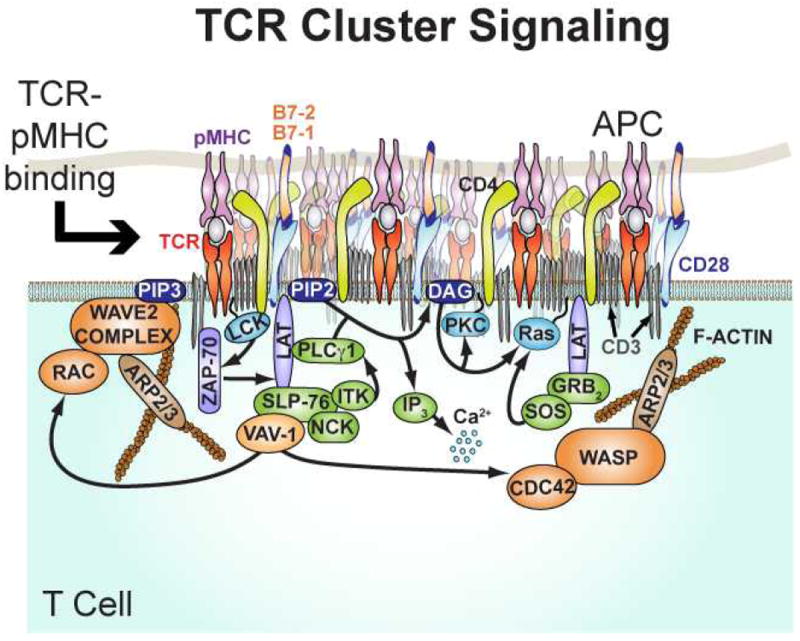
Signaling processes between various immune cells involve large-scale spatial reorganization of receptors and signaling molecules within the cell-cell junction. These structures, now collectively referred to as immune synapses, interleave physical and mechanical processes with the cascades of chemical reactions that constitute signal transduction systems. Molecular level clustering, spatial exclusion, and long-range directed transport are all emerging as key regulatory mechanisms. The study of these processes is drawing researchers from physical sciences to join the effort and represents a rapidly growing branch of biophysical chemistry. Recent advances in physical and quantitative analyses of signaling within the immune synapses are reviewed here.


Figures

Figure 1
Figure 1
Schematic of a T cell receptor microcluster, which is densely packed with a diverse set of signaling molecules. Activation of actin assembly initiates centripetal transport. Adapted from Hartman & Groves Curr. Op. Cell Biol 2011, 23: 370-376
Figure 2
Figure 2
(A) Total internal reflection fluorescence (TIRF) image of T cell receptors (TCRs) labeled with H57 αTCR Fab (Alexa Fluor 594) at 60 seconds after the initial T cell-bilayer contact. (B) Trajectories of all TCR microclusters show their highly confined motion in the central area (left image in panel C) and centripetal movement in the cell periphery (right image in panel C) during the immunological synapse formation. Color bar corresponds to the elapsed time after the initial cell-bilayer contact (t = 0).
Figure 3
Figure 3
Schematic of a hybrid live cell – supported membrane junction. pMHC, ICAM1, and possibly other molecules such as CD80 can be incorporated into a supported membrane where they are free to diffuse laterally and engage their cognate receptors on the live T cell. Structures, such as nanometer scale metal lines, may be fabricated onto the underlying substrate to corral and guide the motion of these supported membrane molecules. Then, through specific receptor-ligand interactions, molecules within the living T cell become subject to the same physical constraints. This type of manipulation is referred to as a spatial mutation. Adapted from Smoligovets A. 2011. J. Cell Sci. in press
Figure 4
Figure 4
Molecular maze experiment. A pattern of barriers in a upported membrane substrate (1.5 μm long, 100 nm wide, and less than 10 nm high) impose obstacles to TCR cluster transport. TCR clusters are observer to percolate through the array of barriers by moving along barriers, at angles to the actin flow, until the edge is reached and the cluster rejoins the centripital flow. These observation led to the suggestion that TCR clusters were frictionally coupled to the flowing actin. Adapted from DeMond AL, Mossman KD, Starr T, Dustin ML, Groves JT. 2008. T cell receptor microcluster transport through molecular mazes reveals mechanism of translocation. Biophys. J. 94: 3286-92
Figure 5
Figure 5
Example of gradient flow tracking analysis actin movement in live primary T cell. (A) Actin is imaged using a fluorescent fusion of the actin binding protein, utrophin. Image analysis is used to identify intensity gradients. The convergence points of these gradients can be tracked reliably. An important feature of this method is that it does not require well resolved objects; irregularly shaped density waves can tracked with precision. This type of analysis has proven more effective in studies of actin flow in primary T cells than speckle microscopy. Adapted from Smoligovets A. 2011. J. Cell Sci. in press
Figure 6
Figure 6
TCR cluster titration experiment. (a) Brightfield images of cells off and on the indicated grid pattern size (scale bar = 5 mm). (b) Schematic of TCR microcluster within indicated area in (a) with pMHC bound to activating agonists (stars) and non-activating null (circles) peptides. (c) Corresponding heat maps that display calcium flux for a population of cells on and off the grids, with each cell shown as a horizontal line and >100 cells per heat map. Adapted from Manz BN, Jackson BL, Petit RS, Dustin ML, Groves J. 2011. Proc. Natl. Acad. Sci. U. S. A. 108: 9089-94

References

    1. Al-Alwan MM, Liwski RS, Haeryfar SMM, Baldridge WH, Hoskin DW, et al. Cutting edge: dendritic cell actin cytoskeletal polarization during immunological synapse formation is highly antigen-dependent. J Immunol. 2003;171:4479–83. - PubMed
    1. Al-Alwan MM, Rowden G, Lee TD, West KA. The dendritic cell cytoskeleton is critical for the formation of the immunological synapse. J Immunol. 2001;166:1452–56. - PubMed
    1. Allen PG, Dawidowicz EA. Phagocytosis in Acanthamoeba: I. A mannose receptor is responsible for the binding and phagocytosis of yeast. J Cell Physiol. 1990;145:508–13. - PubMed
    1. Anderson HA, Hiltbold EM, Roche PA. Concentration of MHC class II molecules in lipid rafts facilitates antigen presentation. Nat Immunol. 2000;1:156–62. - PubMed
    1. Batista FD, Iber D, Neuberger MS. B cells acquire antigen from target cells after synapse formation. Nature. 2001;411:489–94. - PubMed

Publication types

Substances