

Increased levels of prolactin receptor expression correlate with the early onset of lupus symptoms and increased numbers of transitional-1 B cells after prolactin treatment
- PMID: 22404893
- PMCID: PMC3353839
- DOI: 10.1186/1471-2172-13-11
Increased levels of prolactin receptor expression correlate with the early onset of lupus symptoms and increased numbers of transitional-1 B cells after prolactin treatment
Abstract
Background: Prolactin is secreted from the pituitary gland and other organs, as well as by cells such as lymphocytes. Prolactin has an immunostimulatory effect and is associated with autoimmune diseases that are characterised by abnormal B cell activation, such as systemic lupus erythematosus (SLE). Our aim was to determine if different splenic B cell subsets express the prolactin receptor and if the presence of prolactin influences these B cell subsets and correlates with development of lupus.
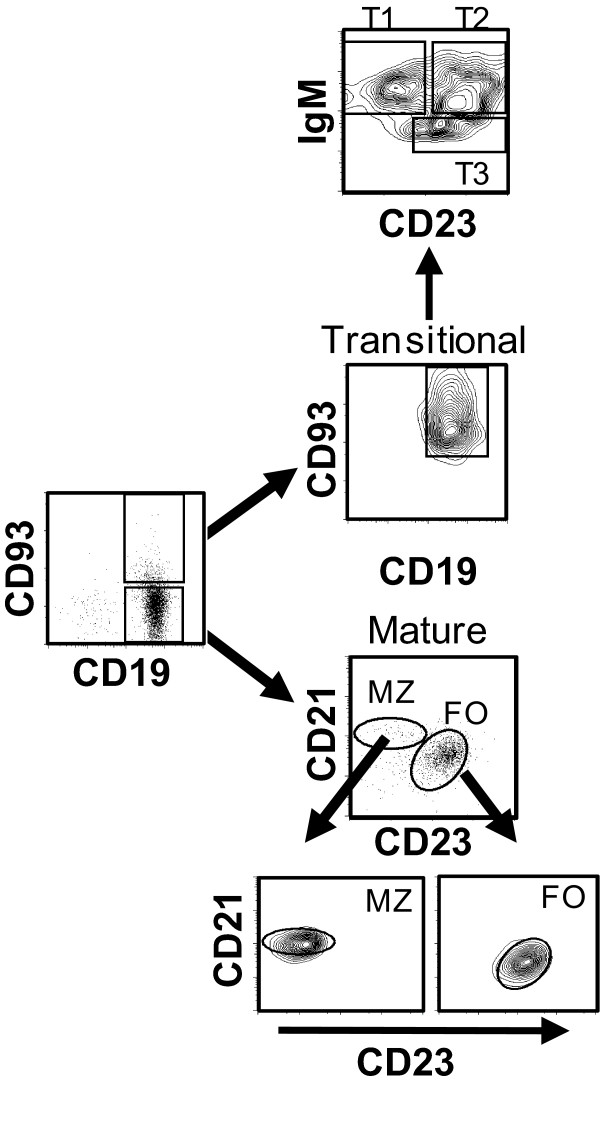
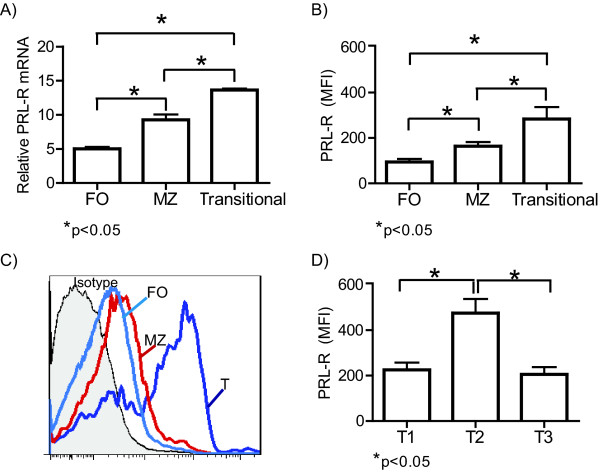
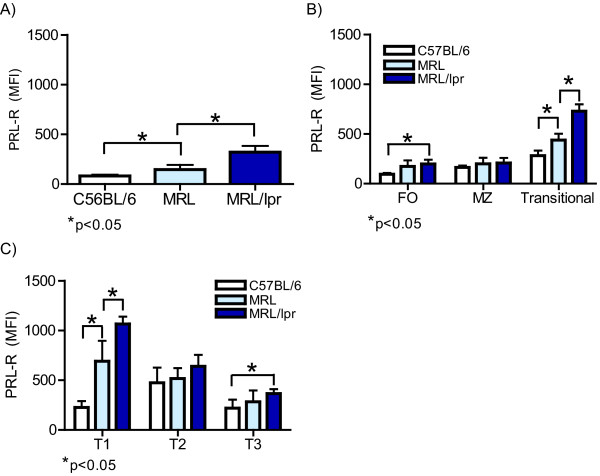
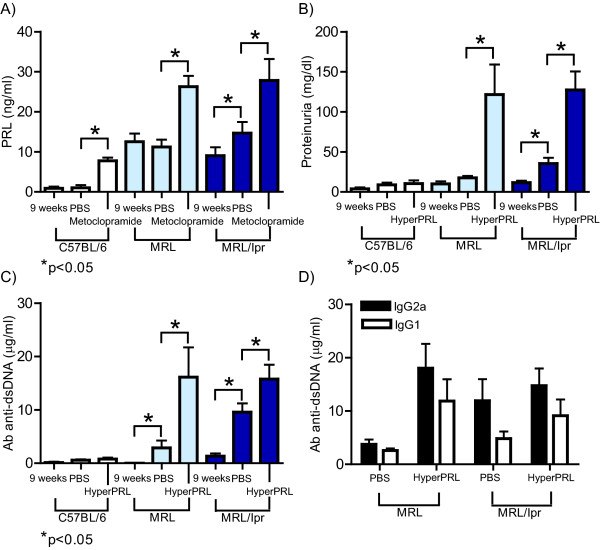
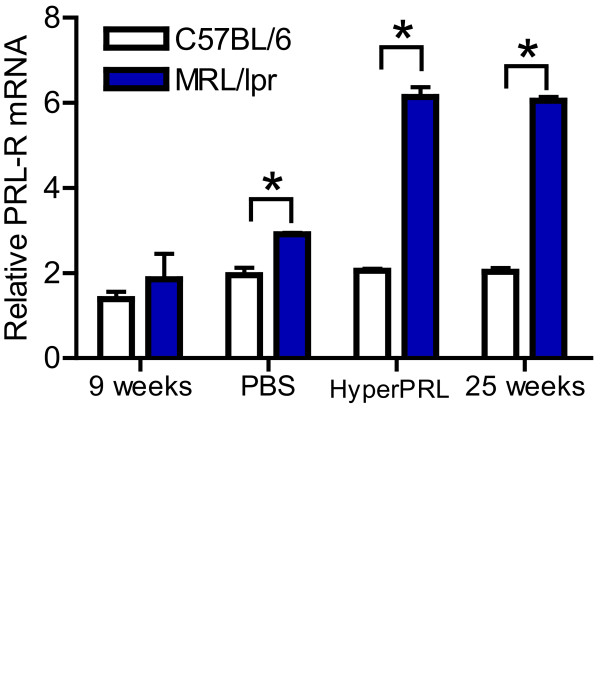
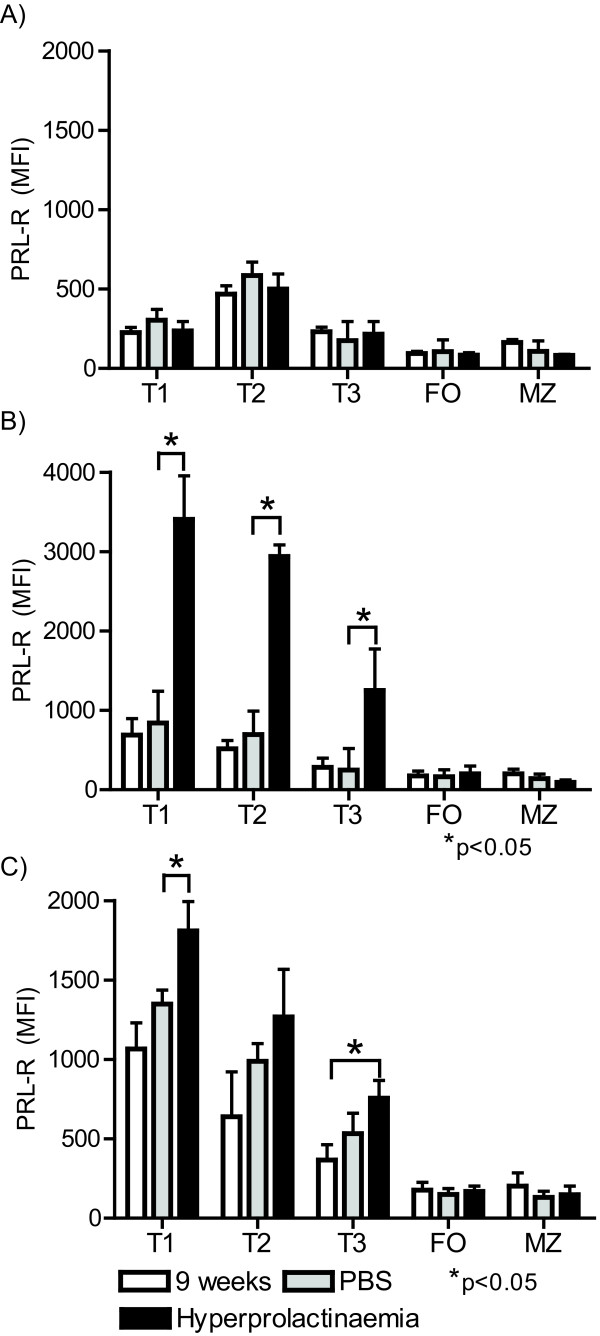
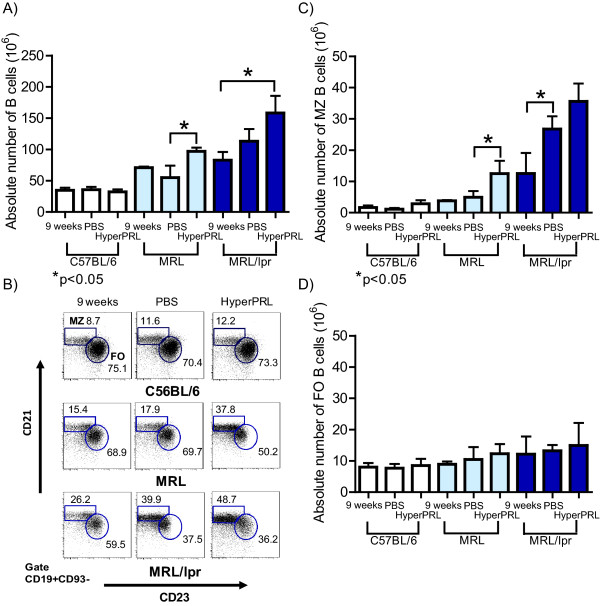
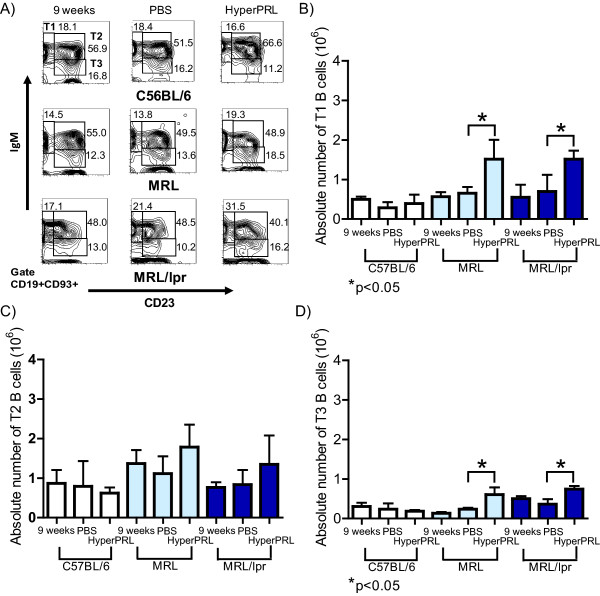
Results: Using real-time PCR and flow cytometry, we found that different subsets of immature (transitional) and mature (follicular, marginal zone) B cells express different levels of the prolactin receptor and are differentially affected by hyperprolactinaemia. We found that transitional B cells express the prolactin receptor at higher levels compared to mature B cells in C57BL/6 mice and the lupus-prone MRL/lpr and MRL mouse strains. Transitional-1 (T1) B cells showed a higher level of prolactin receptor expression in both MRL/lpr and MRL mice compared to C57BL/6 mice. Hyperprolactinaemia was induced using metoclopramide, which resulted in the development of early symptoms of SLE. We found that T1 B cells are the main targets of prolactin and that prolactin augments the absolute number of T1 B cells, which reflects the finding that this B cell subpopulation expresses the highest level of the prolactin receptor.
Conclusions: We found that all B cell subsets express the prolactin receptor but that transitional B cells showed the highest prolactin receptor expression levels. Hyperprolactinaemia in mice susceptible to lupus accelerated the disease and increased the absolute numbers of T1 and T3 B cells but not of mature B cells, suggesting a primary effect of prolactin on the early stages of B cell maturation in the spleen and a role of prolactin in B cell differentiation, contributing to SLE onset.
Figures
Similar articles
-
Prolactin levels correlate with abnormal B cell maturation in MRL and MRL/lpr mouse models of systemic lupus erythematosus-like disease.Clin Dev Immunol. 2013;2013:287469. doi: 10.1155/2013/287469. Epub 2013 Dec 10. Clin Dev Immunol. 2013. PMID: 24454471 Free PMC article.
-
Prolactin Rescues Immature B-Cells from Apoptosis Induced by B-Cell Receptor Cross-Linking.J Immunol Res. 2016;2016:3219017. doi: 10.1155/2016/3219017. Epub 2016 May 24. J Immunol Res. 2016. PMID: 27314053 Free PMC article.
-
Mouse complement receptors type 1 (CR1;CD35) and type 2 (CR2;CD21): expression on normal B cell subpopulations and decreased levels during the development of autoimmunity in MRL/lpr mice.J Immunol. 1997 Aug 1;159(3):1557-69. J Immunol. 1997. PMID: 9233655
-
Prolactin as a modulator of B cell function: implications for SLE.Biomed Pharmacother. 2004 Jun;58(5):310-9. doi: 10.1016/j.biopha.2004.04.007. Biomed Pharmacother. 2004. PMID: 15194167 Review.
-
Dysregulated Lymphoid Cell Populations in Mouse Models of Systemic Lupus Erythematosus.Clin Rev Allergy Immunol. 2017 Oct;53(2):181-197. doi: 10.1007/s12016-017-8605-8. Clin Rev Allergy Immunol. 2017. PMID: 28500565 Review.
Cited by
-
Function of Treg Cells Decreased in Patients With Systemic Lupus Erythematosus Due To the Effect of Prolactin.Medicine (Baltimore). 2016 Feb;95(5):e2384. doi: 10.1097/MD.0000000000002384. Medicine (Baltimore). 2016. PMID: 26844452 Free PMC article.
-
Autoimmune thyroid diseases are more common in patients with prolactinomas: a retrospective case-control study in an Italian cohort.J Endocrinol Invest. 2019 Jun;42(6):693-698. doi: 10.1007/s40618-018-0972-3. Epub 2018 Nov 8. J Endocrinol Invest. 2019. PMID: 30406929
-
Interference of B lymphocyte tolerance by prolactin in rheumatic autoimmune diseases.Heliyon. 2023 Jun 3;9(6):e16977. doi: 10.1016/j.heliyon.2023.e16977. eCollection 2023 Jun. Heliyon. 2023. PMID: 37332964 Free PMC article. Review.
-
The effect of prolactin on immune cell subsets involved in SLE pathogenesis.Front Immunol. 2022 Oct 28;13:1016427. doi: 10.3389/fimmu.2022.1016427. eCollection 2022. Front Immunol. 2022. PMID: 36389803 Free PMC article. Review.
-
Role of abnormal anterior pituitary hormones-growth hormone and prolactin in active systemic lupus erythematosus.Int J Clin Exp Med. 2015 Oct 15;8(10):19223-31. eCollection 2015. Int J Clin Exp Med. 2015. PMID: 26770558 Free PMC article.
References
-
- Chavez-Rueda K, Hernandez J, Zenteno E, Leaños-Miranda A, Legorreta-Haquet MV, Blanco-Favela F. Identification of prolactin as a novel immunomodulator on the expression of co-stimulatory molecules and cytokine secretions on T and B human lymphocytes. Clin Immunol. 2005;116:182–191. doi: 10.1016/j.clim.2005.03.013. - DOI - PubMed
-
- Da Costa R, Szyper-Kravitz M, Szekanecz Z, Csépány T, Dankó K, Shapira Y, Zandman-Goddard G, Orbach H, Agmon-Levin N, Shoenfeld Y. Ferritin and prolactin levels in multiple sclerosis. Isr Med Assoc J. 2011;13:91–95. - PubMed
Publication types
MeSH terms
Substances
LinkOut - more resources
Full Text Sources
Medical
