. 2012 Mar 7;102(5):1049-58.
doi: 10.1016/j.bpj.2012.01.030. Epub 2012 Mar 6.

Actin network growth under load

Affiliations

Actin network growth under load

Otger Campàs et al. Biophys J. .

Abstract

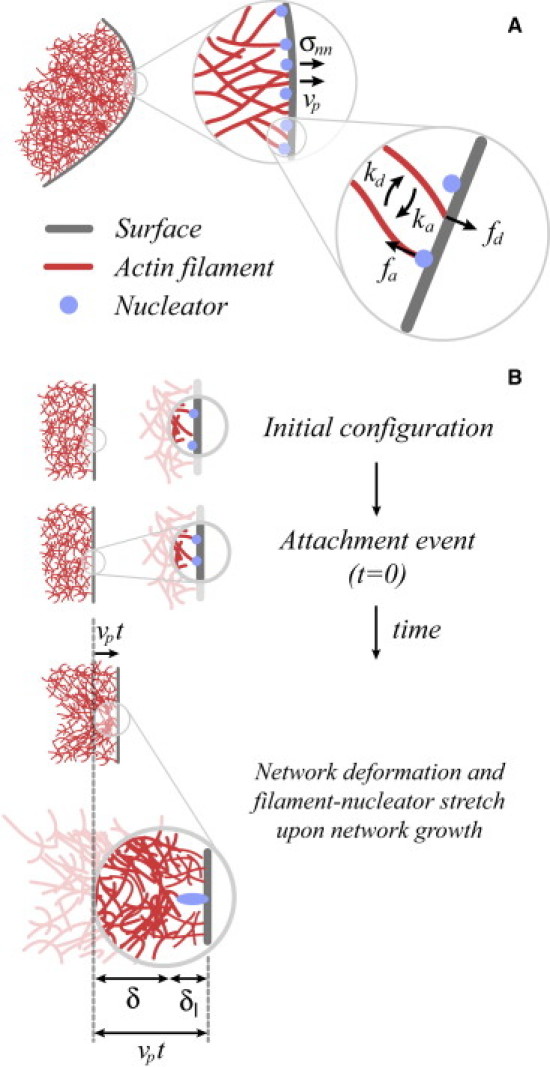
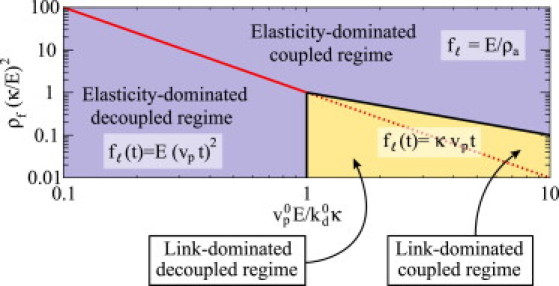
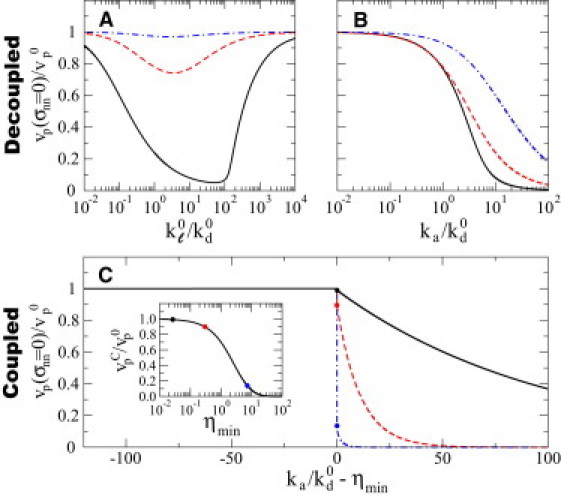
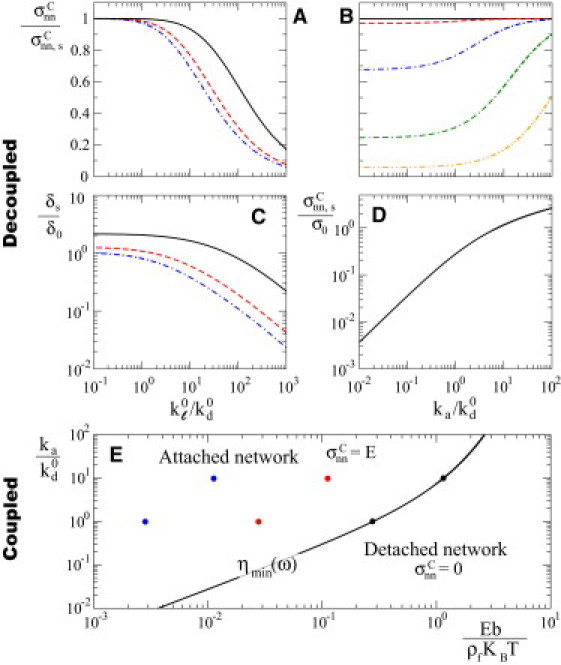
Many processes in eukaryotic cells, including the crawling motion of the whole cell, rely on the growth of branched actin networks from surfaces. In addition to their well-known role in generating propulsive forces, actin networks can also sustain substantial pulling loads thanks to their persistent attachment to the surface from which they grow. The simultaneous network elongation and surface attachment inevitably generate a force that opposes network growth. Here, we study the local dynamics of a growing actin network, accounting for simultaneous network elongation and surface attachment, and show that there exist several dynamical regimes that depend on both network elasticity and the kinetic parameters of actin polymerization. We characterize this in terms of a phase diagram and provide a connection between mesoscopic theories and the microscopic dynamics of an actin network at a surface. Our framework predicts the onset of instabilities that lead to the local detachment of the network and translate to oscillatory behavior and waves, as observed in many cellular phenomena and in vitro systems involving actin network growth, such as the saltatory dynamics of actin-propelled oil drops.


Figures

Figure 1
Figure 1
Actin network growth from a surface. (A) Sketch of an actin network (red mesh) growing from a surface (gray) where actin nucleators (blue) are located. The surface is locally subject to an external normal stress σnn and the network grows at velocity vp. The actin filaments interacting with the surface can be either associated to nucleators or dissociated from them. Dissociated filaments, which polymerize toward the surface and generate an average pushing force fd, associate to nucleators at a rate ka. Filaments associated to nucleators resist the growth with an average force fa per filament and dissociate from nucleators at a rate kd. (B) Nature of the resistive force: After their initial attachment to a nucleator at the surface, attached filaments are continuously loaded by network growth during their lifetime. The initial attachment of a detached filament to a surface nucleator at t = 0 does not impose any instantaneous stretch on either the actin network or the new filament-nucleator link. Once attached to the surface, the new attached filament resists an increasing load over time as a result of network elongation. After a time t, the network has advanced a distance vpt, and the combination of this network elongation with the attachment of the filament at the surface generates deformations δ(t) and δ(t) of the actin network and filament-nucleator link, respectively. (In color online.)
Figure 2
Figure 2
Dynamical regimes and associated filament-link force f(t). The dynamical regimes of the system are shown in their most restrictive form (see text for details). Coupled (vp0ρf/kd01) and decoupled (vp0ρf/kd01) regimes are separated by the red line (continuous and dotted), which corresponds to vp0/kd0=1/ρf. In the decoupled regime, the link force is dominated by either the filament-link deformation (vp0/kd0κ/E; the link-dominated decoupled regime) or the network elasticity (vp0/kd0κ/E; the elasticity-dominated decoupled regime), in which case f(t) = κvpt and f(t) = (Evpt)2, respectively. Similarly, in the coupled regime, the link force is dominated by the filament-link deformation (ρfvp0κ/kd0E1; the link-dominated coupled regime) or the network elasticity (ρfvp0κ/kd0E1; the elasticity-dominated coupled regime), in which case f(t) = κvpt and f = E / ρa, respectively. The yellow and blue regions correspond to the parameter space where the resistive force is dominated by the link and network deformations, respectively. (In color online.)
Figure 3
Figure 3
Network velocity at vanishing external load. (A–C) The growth velocity of the network, vp, relative to the polymerization velocity of individual filaments at vanishing load, vp0, for both the link-dominated uncoupled regime (A and B) and the elasticity-dominated coupled regime (C), as a function of the relevant dimensionless parameters of each regime (Table 1). (A) Dependence of the network velocity vp on k0/kd0 for different values of ka/kd0 (ka/kd0=10,1,0.1, continuous black line, dashed red line, and dashed-dotted blue line, respectively). (B) Growth velocity vp as a function of ka/kd0 for k0/kd0=10,1,0.1 (continuous black line, dashed red line, and dashed-dotted blue line, respectively). (C) Dependence of vp on ka/kd0 in the elasticity-dominated coupled regime. Below ηmin the network is detached from the surface and the detached filaments grow at their maximal velocity vp0. Above ηmin the network velocity decreases for increasing values of ka/kd0 because there are more filaments attached that resist the network growth. The different curves correspond to Eb / ρfkBT = 0.01, 0.1, 1 (continuous black line, dashed red line, and dashed-dotted blue line, respectively). The network velocity, vpc, at the critical point ka/kd0=ηmin depends on the value of ηmin (inset), with the dots highlighting the values of the critical velocity vpc at the values of the parameter Eb / ρfkBT shown in C (same color code). The relation between ηmin and Eb / ρfkBT is shown in Fig. 4. (In color online.)
Figure 4
Figure 4
Critical stresses. Maximal pulling stresses above which the network is detached from the surface in both the link-dominated uncoupled regime (A–D) and the elasticity-dominated coupled regime (E). (A and B) Dependence of the critical stress σnnc, normalized to the critical stress σnn,sc for a static network, on k0/kd0 (A) and ka/kd0 (B). The different curves in A correspond to ka/kd0=10,1,0.1 (continuous black line, dashed red line and dashed-dotted blue line, respectively), and in B they correspond to k0/kd0=0.1,1,10,102,103 (continuous black line, dashed red line, dashed-dotted blue line, double dashed-dotted green line, dashed-doubled dotted orange line, respectively). (C) Static stretch δs as a function of k0/kd0 for ka/kd0=10,1,0.1 (same code as in A). (D) Dependence of the critical stress σnn,sc for a static network on ka/kd0. (E) Dynamical regimes in the elasticity-dominated coupled regime, which depend only on the parameters ka/kd0 and Eb / ρfkBT. The line ηmin separates the parameter space in which the network is detached from the surface and that in which the network maintains contact to the surface. In the latter case, the critical stress is σnnc=E. (In color online.)
Figure 5
Figure 5
Stress-velocity relations. Network growth velocity vp as a function of the applied stress σnn in both the link-dominated uncoupled regime (A and B) and the elasticity-dominated coupled regime (C and D). Shadowed areas indicate pulling stresses. (A and B) The link-dominated uncoupled regime, showing the dependence of the stress-velocity relation on the ratio ka/kd0 (ka/kd0=10,1,0.1; continuous black line, dashed red line, and dashed-dotted blue line, respectively) for small and large loading rates, (A) k0/kd0=0.1 and (B) k0/kd0=102, respectively. The dots correspond to the critical pulling stress of each curve. (C and D) The elasticity-dominated coupled regime, showing the dependence of the stress-velocity relation on the parameter Eb / ρfkBT for (C) ka/kd0=1(Eb / ρfkBT = 0.28, 0.028, 0.0028; continuous black line, dashed red line, and dashed-dotted blue line, respectively) and (D) ka/kd0=10(Eb / ρfkBT = 1.15, 0.115, 0.0115; continuous black line, dashed red line, and dashed-dotted blue line, respectively). The values of the parameters for the stress-velocity relations shown are marked as dots in Fig. 4E. (In color online.)

References

    1. Bray D. Garland; New York: 1992. Cell Movements.
    1. Alberts B., Bray D., Watson J.D. 3rd ed. Garland; New York: 2004. Molecular Biology of the Cell.
    1. Charras G.T., Yarrow J.C., Mitchison T.J. Non-equilibration of hydrostatic pressure in blebbing cells. Nature. 2005;435:365–369. - PMC - PubMed
    1. Taunton J., Rowning B.A., Larabell C.A. Actin-dependent propulsion of endosomes and lysosomes by recruitment of N-WASP. J. Cell Biol. 2000;148:519–530. - PMC - PubMed
    1. Goldberg M.B. Actin-based motility of intracellular microbial pathogens. Microbiol. Mol. Biol. Rev. 2001;65:595–626. (table of contents.) - PMC - PubMed

Publication types

LinkOut - more resources