. 2012 Mar 7;102(5):1174-83.
doi: 10.1016/j.bpj.2012.01.040. Epub 2012 Mar 6.

Factors affecting the quantification of biomolecular interactions by fluorescence cross-correlation spectroscopy

Affiliations

Factors affecting the quantification of biomolecular interactions by fluorescence cross-correlation spectroscopy

Yong Hwee Foo et al. Biophys J. .

Abstract

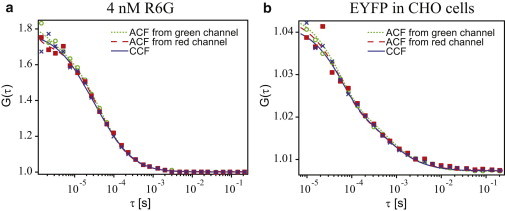
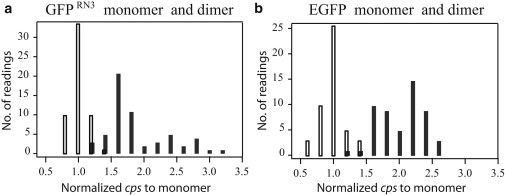
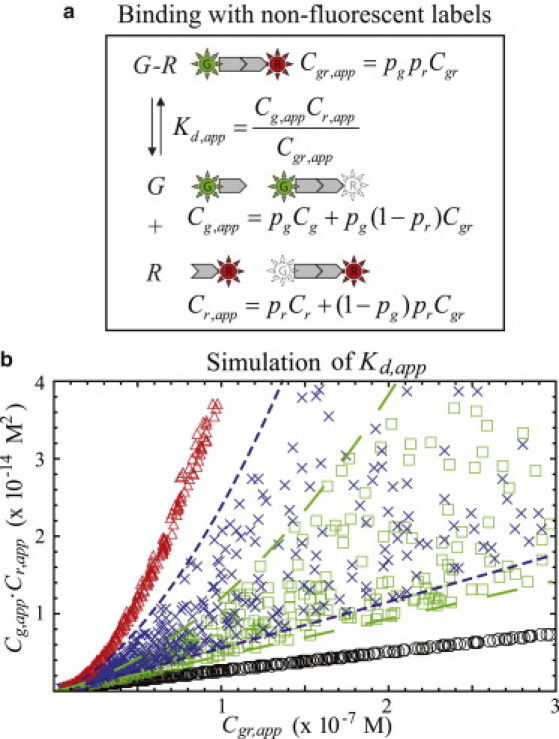
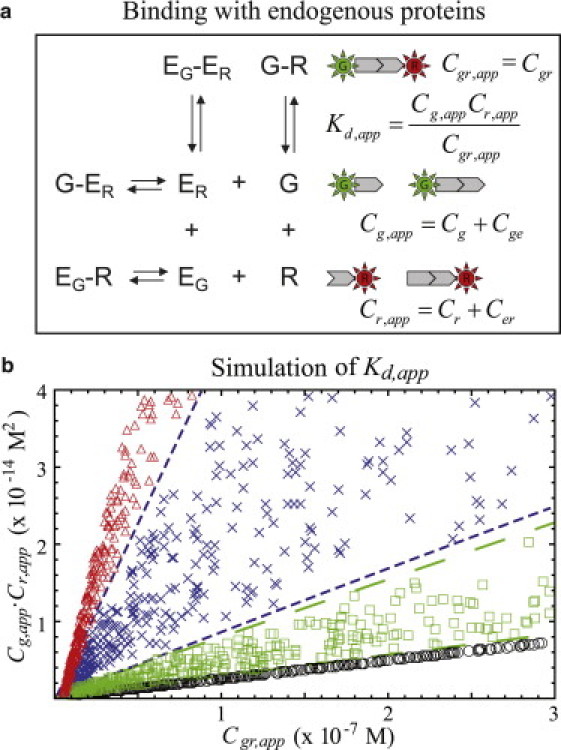
Fluorescence cross-correlation spectroscopy (FCCS) is used to determine interactions and dissociation constants (K(d)s) of biomolecules. The determination of a K(d) depends on the accurate measurement of the auto- and cross-correlation function (ACF and CCF) amplitudes. In the case of complete binding, the ratio of the CCF/ACF amplitudes is expected to be 1. However, measurements performed on tandem fluorescent proteins (FPs), in which two different FPs are linked, yield CCF/ACF amplitude ratios of ~0.5 or less for different FCCS schemes. We use single wavelength FCCS and pulsed interleaved excitation FCCS to measure various tandem FPs constituted of different red and green FPs and determine the causes for this suboptimal ratio. The main causes for the reduced CCF/ACF amplitude ratio are differences in observation volumes for the different labels, the existence of dark FPs due to maturation problems, photobleaching, and to a lesser extent Förster (or fluorescence) resonance energy transfer between the labels. We deduce the fraction of nonfluorescent proteins for EGFP, mRFP, and mCherry as well as the differences in observation volumes. We use this information to correct FCCS measurements of the interaction of Cdc42, a small Rho-GTPase, with its effector IQGAP1 in live cell measurements to obtain a label-independent value for the K(d).


Figures

Figure 1
Figure 1
SW-FCCS experiments of a single fluorophore cross correlated in two detection channels, 530–560 nm and 590–645 nm, using 514 nm excitation. The experimental green ACF (open circles), red ACF (solid squares), and CCF (crosses) are background corrected. The lines are the fits to the data. (a) 4 nM R6G solution at a laser power of 15 μW. (b) Enhanced yellow fluorescence protein (∼170 nM) measured using 4 μW in CHO cells. The correlation functions do not decay to 1 due to photobleaching of yellow fluorescence protein during the measurement.
Figure 2
Figure 2
Histograms of determined brightnesses (cps) for (a) GFPRN3 monomer (open bars) and dimer (solid bars); (b) EGFP monomer (open bars) with dimer (solid bars). Data are normalized to the average value of the corresponding monomer's brightness.
Figure 3
Figure 3
SW-FCCS measurements with mCherry-14-EGFP in CHO cells normalized to the green ACF (not shown here). Symbols are the experimental data while the lines are the fits to the data. (a) SW-FCCS measurements of mCherry-14-EGFP at 20 μW using 514 nm laser excitation after 2 h of CHX treatment compared with untreated cells. The red ACF (open triangles) and CCF (crosses) before adding CHX, and the red ACF (solid squares) and CCF (open diamonds) after 2 h of CHX treatment are shown here. The GR(0)s in the absence of mCherry's photodynamics are shown from the extrapolated lines from the main body of the red ACFs (dashed lines). (b) The red ACF (solid squares) and CCF (open diamonds) show the measurements of mCherry-14-EGFP after CHX treatment and with “blind” selection (i.e. without the aid of fluorescence excitation) at 2 μW. The red ACF (open triangles) and CCF (crosses) show the measurement without “blind” selection or CHX treatment. In Fig. 3b, the photodynamics of mRFP is also observed to be slower compared to the data presented in Fig. 3a due to the lower excitation power used in the experiment (2 μW vs. 20 μW), which is consistent with what has been observed previously (47).
Figure 4
Figure 4
PIE-FCCS experiments in the presence of FRET are represented by open circles (green ACF), solid squares (red ACF), and crosses (CCF). PIE-FCCS experiments after correcting for FRET are represented by solid triangles (green ACF) and open diamonds (CCF). The lines are the experimental data. (a) mCherry-14-EGFP in live CHO cells and (b) mCherry-7-EGFP in cell lysate are shown. The influence of FRET is observable in both experiments.
Figure 5
Figure 5
Binding studies in the presence of nonfluorescent fusion proteins. (a) A graphical representation of Eqs. S15–S17 where nonfluorescent labels influence the Kd,app. G and R represent the green- and red-labeled molecules, respectively. (b) Simulations of Kd = 24 nM at pg and pr = 1 (open circles); pg = 1 and pr = 0.4 (open squares); pg = 1 and pr = 0.2 (crosses), and pg = 0.4 and pr = 0.4 (open triangles). This was simulated for 20 nM to 3 μM of green and red molecules and restricting the ratio of red/green molecules at 0.7 to 1.5 (refer to Supporting Material). The long dashed lines represent the border of the pg = 1 and pr = 0.4 simulation whereas the short dashed lines represent the border of the pg = 1 and pr = 0.2 simulation.
Figure 6
Figure 6
Binding studies in the presence of endogenous protein. (a) A graphical representation of Eqs. S21–S23 describing the interactions of labeled and endogenous proteins. G and R represent the green- and red-labeled molecules, respectively. EG and ER represent the endogenous proteins of the green- and red-labeled molecules, respectively. (b) Kd,app simulations (using a Kd of 24 nM) in the presence of different amounts of endogenous proteins, namely no endogenous proteins (open circles), 10–100 nM (open squares), 100–500 nM (crosses), and 500–1000 nM (open triangles). The amount of labeled protein was varied from 20 nM to 3 μM and the ratio of red/green molecules was restricted to be between 0.7 and 1.5 (refer to Supporting Material). The long dashed lines represent the border of the 10–100 nM simulation whereas the short dashed lines represent the border of the 100–500 nM simulation.
Figure 7
Figure 7
Experimental Kd,app plots generated by SW-FCCS. The linear fits (dashed lines) serve as a guide to the eye. (a) Measurements of mRFP-Cdc42 + EGFP-IQGAP1 (solid circles) and; measurements of mCherry-Cdc42 + EGFP-IQGAP1 (crosses). Their average Kd,app are 382 ± 136 nM and 233 ± 92 nM, respectively. (b) Twice the amount of unlabeled Cdc42 compared to labeled Cdc42 was transfected together with mCherry-Cdc42 + EGFP-IQGAP1 (solid circles). This was compared with the measurement done in cells with only mCherry-Cdc42 + EGFP-IQGAP1 (crosses). The average Kd,app determined in the presence of the unlabeled competitor is 446 ± 152 nM.

References

    1. Schwille P., Meyer-Almes F.J., Rigler R. Dual-color fluorescence cross-correlation spectroscopy for multicomponent diffusional analysis in solution. Biophys. J. 1997;72:1878–1886. - PMC - PubMed
    1. Kettling U., Koltermann A., Eigen M. Real-time enzyme kinetics monitored by dual-color fluorescence cross-correlation spectroscopy. Proc. Natl. Acad. Sci. USA. 1998;95:1416–1420. - PMC - PubMed
    1. Koltermann A., Kettling U., Eigen M. Rapid assay processing by integration of dual-color fluorescence cross-correlation spectroscopy: high throughput screening for enzyme activity. Proc. Natl. Acad. Sci. USA. 1998;95:1421–1426. - PMC - PubMed
    1. Rigler R., Földes-Papp Z., Schnetz A. Fluorescence cross-correlation: a new concept for polymerase chain reaction. J. Biotechnol. 1998;63:97–109. - PubMed
    1. Rippe K. Simultaneous binding of two DNA duplexes to the NtrC-enhancer complex studied by two-color fluorescence cross-correlation spectroscopy. Biochemistry. 2000;39:2131–2139. - PubMed

Publication types

Substances